Rural households now have smartphones and internet access at close to urban rates, and far more of them own a motor vehicle than a decade ago. Yet since 2017-18 rural pay for regular and casual work has fallen further behind urban pay, and self-employed earnings have not caught up.
Exploverse Research · Deep Dive · Policy · 33 min read
Rural India has converged faster as a consumer than as a worker
Key takeaways
- Household access has nearly closed. In early 2025, on MoSPI's survey definition of rural, which follows the Census line, 82.1% of rural households had a smartphone against 91.3% of urban ones, and 92.7% of rural 15 to 29 year olds had used the internet in the previous three months against 95.7% in towns and cities.1
- Spending converged as a ratio, not in rupees. At 2011-12 prices, average monthly spending per person rose from Rs 1,430 to Rs 2,079 in rural India and from Rs 2,630 to Rs 3,632 in urban India between 2011-12 and 2023-24, on MoSPI's surveys and its definition of rural.2 Rural spending grew faster, by 45% against 38% by our arithmetic, so urban spending went from 84% above rural to 75% above; MoSPI's headline figure, at current prices, is 70%.3 2 Yet the urban person's spending rose by about Rs 1,000 and the rural person's by about Rs 650, so the gap in constant rupees widened from Rs 1,200 to Rs 1,553, by our arithmetic. MoSPI changed the survey's design between the two years.2
- Pay for wage work moved the other way. For regular wage and casual work, urban earnings rose further ahead of rural earnings in every quarter we compared between 2017-18 and 2023-24; for regular work the urban figure was 1.32 times the rural one in April to June 2018 and 1.43 times in April to June 2024, by our arithmetic. Self-employed earnings held their ratio on a four-quarter average. All of this comes from one survey, the PLFS, on the same definition.4 5
- Work changed by sex, in opposite directions. Rural men's share in farming (PLFS) fell from 55.0% to 49.4% between 2017-18 and 2023-24, while rural women's rose from 73.2% to 76.9% as their participation roughly doubled.6 5 7
- The line itself is old. The Census test for a town has stood in its current form since 1981, Census 2027 keeps it, and published estimates of India's urban share run from 26% to above 80%.8 9 10
The Argument in One Paragraph
Rural India has converged with urban India faster as a consumer than as a worker. On household access to phones, the internet, roads, power and bank accounts, the gap has nearly closed. On what households own, it has narrowed for motor vehicles and televisions but not for refrigerators or washing machines. On spending, the ratio has narrowed while the rupee gap has widened, a comparison that crosses a change in survey design. On pay for regular and casual work, rural India has fallen further behind since 2017-18; on self-employment it has not caught up. The structure of work has changed slowly, and differently for men and women: rural men are leaving farming, and rural women have moved into it. The evidence supports a moderate form of the "one Indian consumer" idea: it holds for access, for young people online and for better-off rural households, and it does not hold for the rural median, for work, for earnings or for wealth. Underneath all of this sits a question this article states but does not settle: whether the line between rural and urban is drawn in the right place at all.
Two Measures, Two Answers
In 2011-12, 6.2% of the poorest rural households owned a motorcycle, a scooter or a car. By 2023-24 the figure was 47.1%, though MoSPI changed the survey's design in between.11 2 The "poorest" here means the bottom 40% of rural households within each state, the definition the Economic Advisory Council to the Prime Minister used when it analysed MoSPI's household spending surveys, and "motor vehicle" means a two-wheeler, a four-wheeler or both.11 In twelve years, owning a motorised vehicle went from being unusual among poorer rural families to something nearly half of them do.
Now set beside that a second measure. In April to June 2018, a rural worker in a regular salaried job earned Rs 13,207 a month on average and an urban one Rs 17,473.4 By April to June 2024 the figures were Rs 17,033 and Rs 24,434.5 By our arithmetic, the urban figure was 1.32 times the rural one at the start and 1.43 times at the end, and the gap in rupees grew from Rs 4,266 to Rs 7,401 a month. The other three quarters of each year point the same way. Both come from MoSPI's Periodic Labour Force Survey (PLFS), whose rural sector follows the Census line.4
These two facts do not contradict each other. More earners per household and a decade of nominal income growth can put a motor vehicle in a poorer household even when each worker's pay falls behind that of a city worker. But they point to the question this article tries to answer. When people say rural India is becoming more like urban India, which rural India, and like urban India in what?
The answer depends on what you measure. On what households can reach and, partly, on what they own, the gap between rural and urban India has narrowed sharply. On how rural people earn a living, what they earn and what they hold as wealth, it has narrowed far less. On pay for regular and casual work it has widened since 2017-18, and on self-employment it has not narrowed. Rural India has converged as a consumer faster than as a worker.
Each half of that claim needs testing against the strongest evidence on the other side. First comes a prior question: where the line between rural and urban is drawn, and by whom.
Where Does Rural End?
India's official definition of urban comes from the Census. A place is urban if it is a statutory town, meaning it has "a municipality, corporation, cantonment board or notified town area committee". Any other place is urban if it meets three tests: "a minimum population of 5,000; at least 75 per cent of the male main workers engaged in non-agricultural pursuits; and a density of population of at least 400 per sq. km."12 These are census towns. Everything else is rural.
The test is old. The three-part rule dates from the 1961 Census, and its present form has stood since 1981, when the Census dropped the discretion of state census superintendents and began counting plantation, forestry and fishing work as agricultural.8 The Registrar General and the Ministry of Housing and Urban Affairs (MoHUA) gave the committee that examined it in 2026 different dates for the steps in between.8 Census 2027, already under way, keeps the criteria used in Census 2011.8 The Registrar General told the committee the definition was kept "to maintain uniformity, comparability, and reliability of data overtime".8
At least four other lines are in official use, and market trackers draw their own:
- The NSS sector. MoSPI's surveys define rural and urban as the Census does, but they sample rural areas from Census 2011 villages and update the urban frame as new statutory towns appear.4 A village that has grown since 2011 but has not been notified as a town stays in the rural frame.
- The RBI's population groups. For banking statistics a rural centre has fewer than 10,000 people, based on Census 2011.13
- NABARD. Its rural finance survey covers all centres with fewer than 50,000 people; in 2021-22, 9% of its sample households were semi-urban.14
- TRAI. Telecom operators report subscribers as rural or urban, and TRAI's quarterly report does not define the term.15
- Industry trackers. NielsenIQ's "rural" is places under 10,000 people.16 The Federation of Automobile Dealers Associations (FADA) classifies sales by the location of the registering transport office, on a rule it does not disclose.17
Each line gives a different India, as Chart 1 shows.
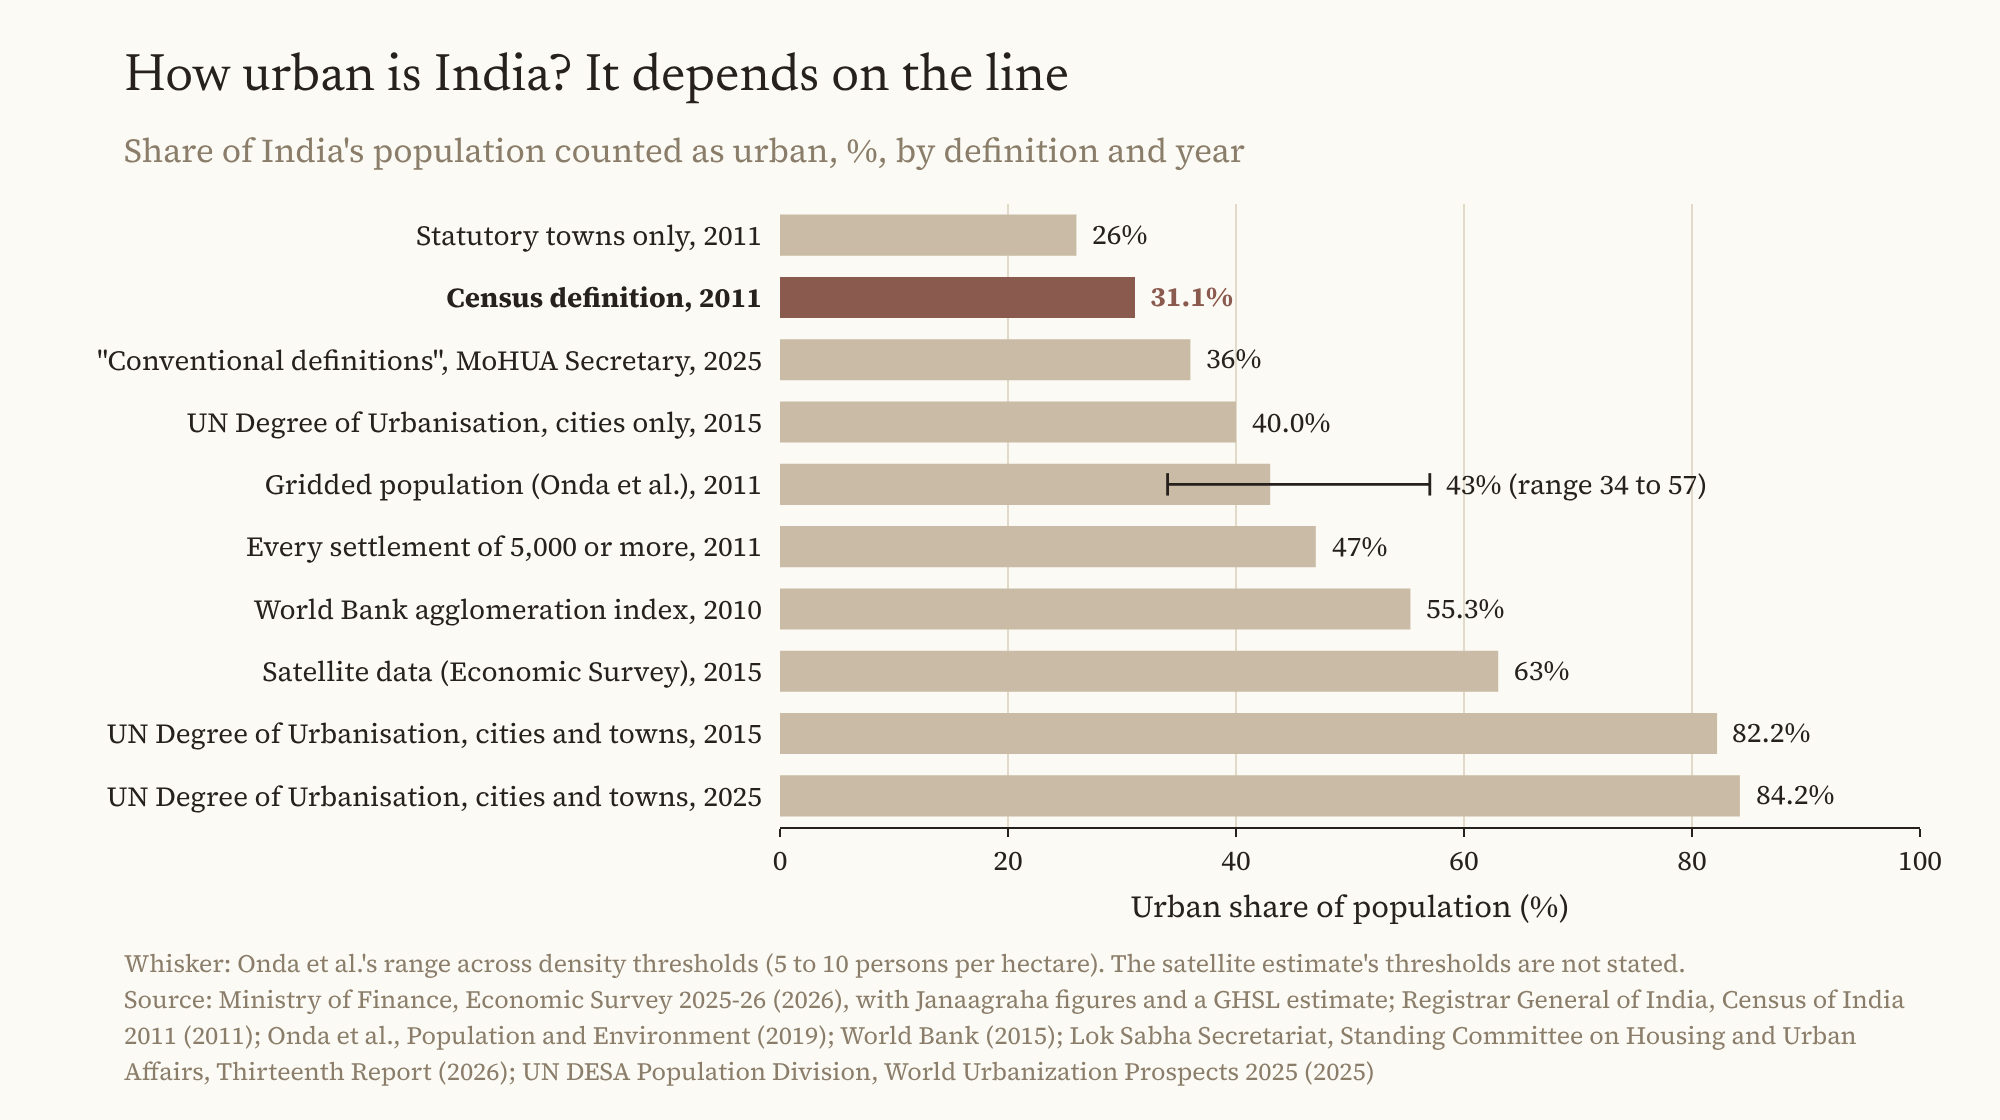
Published estimates of India's urban share range from 26% (statutory towns only, 2011) to 84.2% (cities plus towns on the UN's Degree of Urbanisation, 2025); the Census definition gives 31.1% for 2011. The 36% is the MoHUA Secretary's evidence to a parliamentary committee in October 2025, published in the committee's 2026 report. The definition, not the country, sets the answer. Source: Ministry of Finance, Economic Survey 2025-26 (2026), with Janaagraha figures and a GHSL estimate; Registrar General of India, Census of India 2011 (2011); Onda et al., Population and Environment (2019); World Bank (2015); Lok Sabha Secretariat, Standing Committee on Housing and Urban Affairs, Thirteenth Report (2026); UN DESA Population Division, World Urbanization Prospects 2025 (2025).
Count only statutory towns and India was 26% urban in 2011.18 9 The Census, adding census towns, put it at 31.1%.18 In October 2025 the Secretary of MoHUA told the committee India is "36 per cent urban" on "certain conventional definitions".8 A gridded population study by Onda and co-authors put the 2011 figure at 43%, within a range of 34% to 57% depending on the density threshold.19 Count every settlement of 5,000 people or more as urban and the share was 47%, according to figures from the civil-society group Janaagraha that the Economic Survey reproduced.9 The World Bank's agglomeration index put 55.3% of Indians in places with urban features in 2010.20 The Economic Survey 2025-26, using satellite data, said India "was 63 per cent urban in 2015", without stating its thresholds.9 On the UN's harmonised Degree of Urbanisation, 40.0% of Indians lived in cities in 2015, and 82.2% lived in cities or towns; by 2025 the second figure was 84.2%.10
None of these is the right answer. The UN's Degree of Urbanisation classifies places by population size, density and contiguity alone.21 By our reading it has no test of what residents do for a living, so a dense settlement of farming families can count as urban. In our judgement, that is the strongest objection to the high estimates. But the spread shows that India's urban share is a choice of method before it is a fact.
The census-town record shows how the official line strains. Census towns rose from 1,362 in 2001 to 3,892 in 2011.22 Of the 2,576 new census towns identified in 2011, 175 were later notified as statutory towns, 367 were merged into existing ones and 12 in Delhi are treated as statutory; more than 3,000 census towns are still governed by rural local bodies.8 Pradhan estimated that new census towns, more than 90% of them former villages, accounted for 29.5% of urban population growth between 2001 and 2011 (26% on his lower estimate).23
Large villages are a second strain. In 2011, villages of 5,000 people or more were 3.9% of inhabited villages, by our arithmetic, but held 196.3 million people, 23.5% of the rural population.24 25 In 2001 the share was 21.8%, by our addition of the Census size classes.26 The spread between states is wide: 98.7% of rural Keralites lived in villages of 5,000 or more, against 42.1% in Bihar, 19.2% in Uttar Pradesh and 3.8% in Odisha.25
This raises a possibility we cannot test: if larger villages account for much of the measured rural catch-up, some of it is unrecorded urbanisation, a composition effect rather than a change in the countryside. Testing it needs survey results by village size, which MoSPI's published reports do not provide.
What we can do is test convergence within one line at a time. For each measure below we compute two numbers: the ratio of the rural value to the urban one, and the gap between them in points or rupees. We call a measure converged when the ratio is at least 0.90 and the gap is no more than 10 points (or 10% of the urban level for rupee measures). It is converging when the ratio rises by at least 0.03 and the gap narrows by more than a point. If the ratio rises but the gap stays flat or widens, we call it ratio-only, which is what growth from a low base looks like. Where urban levels are at 95% or more, we judge on the gap alone.
What the Countryside Buys
The case for one market
The consumer case deserves to be made at full strength, because much of it holds. Every MoSPI survey figure in this section uses the NSS rural sector, and every trend from 2011-12 crosses a survey break, which we return to below.
Start with spending. MoSPI's Household Consumption Expenditure Survey (HCES) found that average monthly spending per person in urban India was 84% higher than in rural India in 2011-12, 71% higher in 2022-23 and 70% higher in 2023-24, in current prices.3 Once free food grains and other items from government schemes are valued, the 2023-24 gap falls to 67%.3 At 2011-12 prices, rural spending per person rose from Rs 1,430 to Rs 2,079 and urban from Rs 2,630 to Rs 3,632.2 By our arithmetic, that is a rise of 45% in rural areas against 38% in urban ones.
The mix of spending moved too. Food fell from 52.9% of rural spending in 2011-12 to 47.0% in 2023-24, while in urban India it fell from 42.6% to 39.7%.27 Spending on conveyance, MoSPI's item group for transport, rose from 4.2% to 7.6% of the rural budget.27
Ownership tells the same story for some goods. Rural households owning a motor vehicle rose from 19.0% to 59.0% between 2011-12 and 2023-24, against 40.1% to 68.2% in urban areas.11 The ratio rose from 0.47 to 0.87 and the gap fell from 21.1 points to 9.2, by our arithmetic. NFHS-5, a separate survey on the Census line, found 44.3% of rural and 60.6% of urban households with a motorcycle or scooter in 2019-21, between the two EAC-PM readings.28 Rural mobile phone ownership reached 96.5% of households, against 97.7% in towns and cities.11 Television tells a different story: rural ownership rose from 49.6% to 61.1% while urban ownership fell from 80.4% to 78.5%, so the gap narrowed partly because urban households gave up their sets.11
The market data that companies read is more mixed, and it comes from commercial and industry sources using their own lines. FADA reports that rural transport offices accounted for 57.8% of two-wheeler retail sales and 39.7% of passenger vehicle sales in 2025-26. Rural passenger vehicle sales grew faster than urban ones that year, by 17.12% against 10.43%, but two-wheeler sales grew faster in towns, by 15.21% against 12.11%, and the rural share of two-wheelers slipped from 58.5%.17 NielsenIQ, a market research firm, reported that rural packaged-goods volumes grew faster than urban ones for eight consecutive quarters to October to December 2025.29
Then there is the overlap. MoSPI ranks rural and urban households separately into spending classes, at current prices and ignoring rural-urban differences in price levels.2 In 2023-24, rural households in the 80th to 90th percentile spent an average of Rs 5,763 per person a month, about as much as the urban middle, the 40th to 50th percentile, at Rs 5,622. The top 5% of rural households averaged Rs 10,137, against Rs 10,139 for the urban 80th to 90th percentile.2 27 Taken as a whole, the top rural tenth averaged about Rs 8,533, by our arithmetic from MoSPI's two 5% classes (Rs 6,929 and Rs 10,137), close to the urban 70th to 80th percentile at Rs 8,353.27 The overlap is not new: in 2022-23 the rural 80th to 90th percentile spent Rs 5,356, more than the Rs 4,963 of the urban 40th to 50th percentile.27
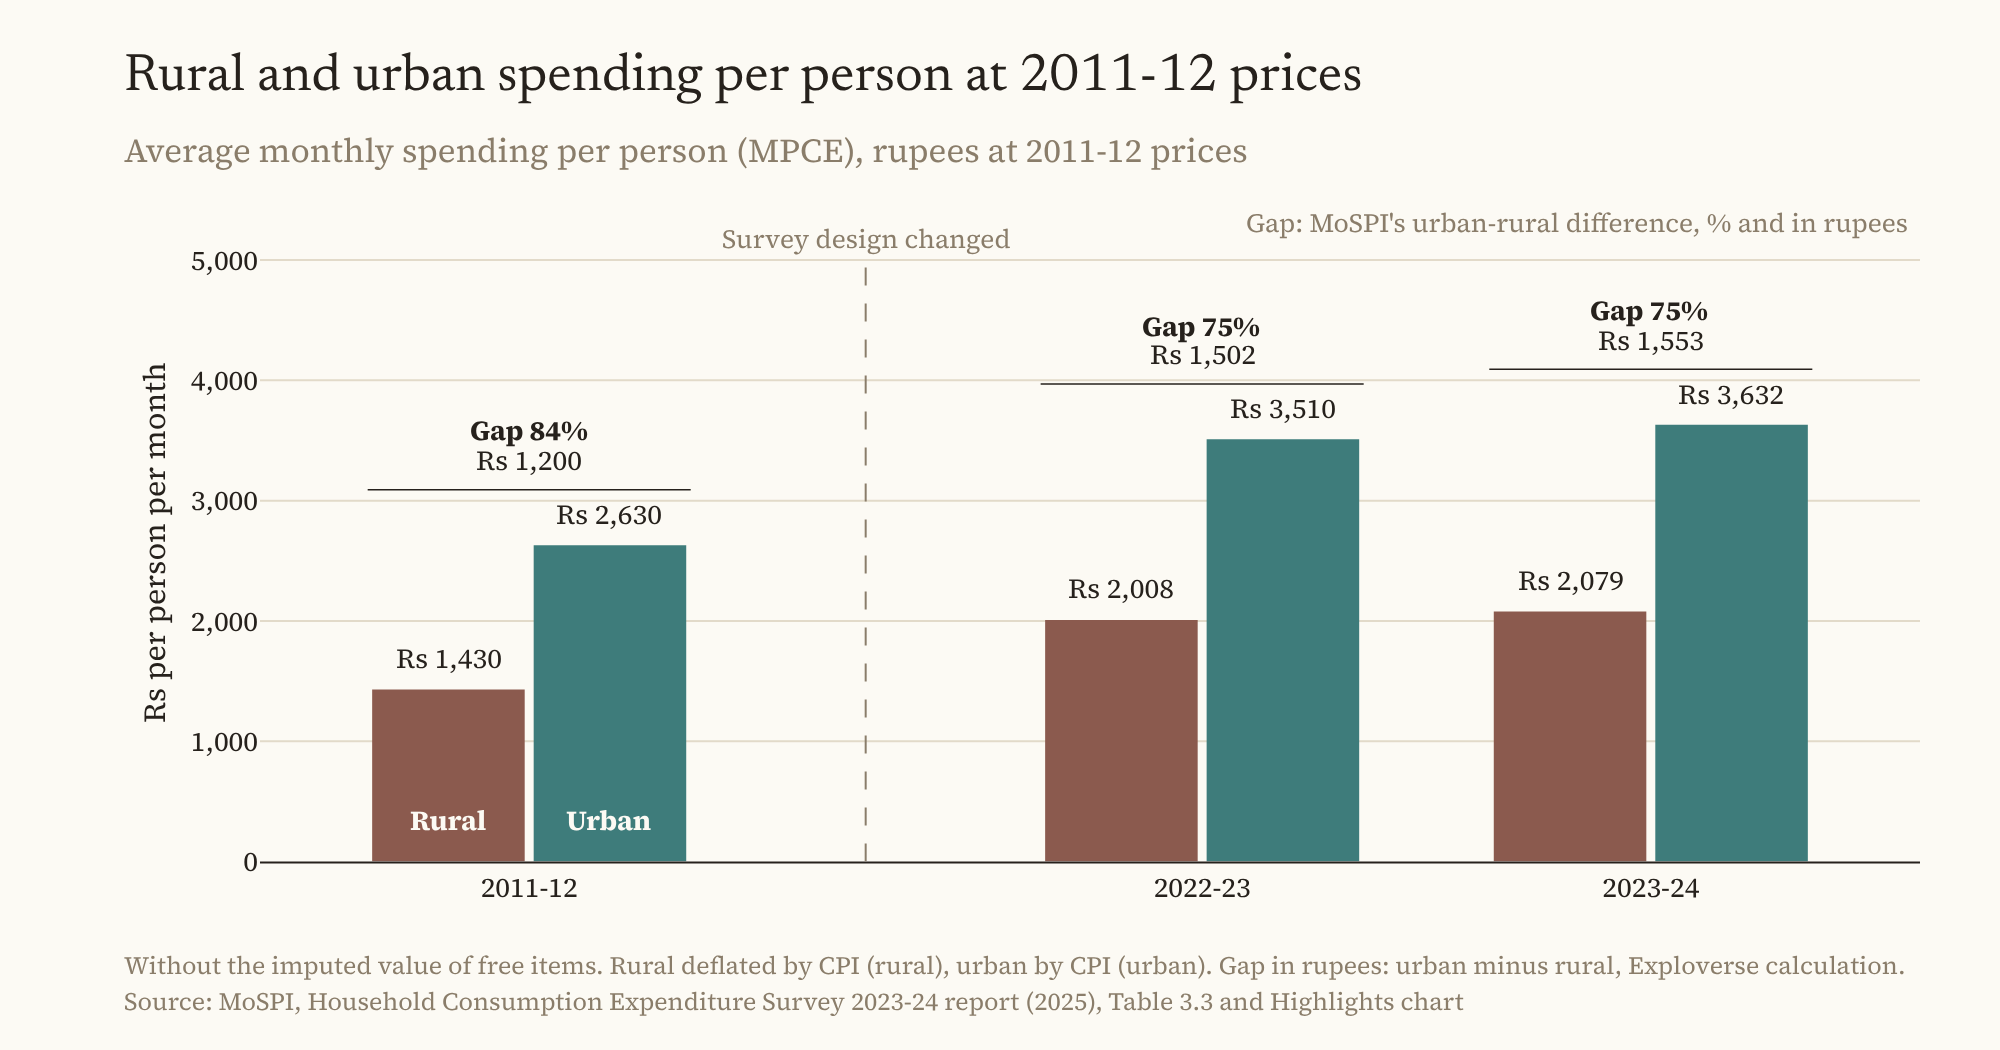
Rural spending per person rose faster than urban between 2011-12 and 2023-24, so the urban-rural gap fell from 84% to 75% on MoSPI's own constant-price chart. In constant rupees, the gap widened from Rs 1,200 in 2011-12 to Rs 1,502 in 2022-23 and Rs 1,553 in 2023-24. The survey design changed after 2011-12. Source: MoSPI, Household Consumption Expenditure Survey 2023-24 report (2025), Table 3.3 and Highlights chart.
Read this way, the evidence describes a single national market in which a better-off rural household buys like an urban middle-class one. That is the strong form of the "one Indian consumer" idea, and for the top fifth of rural households it holds.
Where the case runs out
It runs out in four places.
The first is prices. The headline 70% is, in MoSPI's words, "in nominal terms, and ignoring rural-urban differences in price levels".2 MoSPI deflates rural spending by the rural consumer price index and urban spending by the urban one, and its own chart of spending at 2011-12 prices labels the gap 84%, 75% and 75% for 2011-12, 2022-23 and 2023-24.2 By our arithmetic, the implied price rise over the period was 98% for rural households and 93% for urban ones, which is why the constant-price gap is wider. The ratio of rural to urban spending at 2011-12 prices rose from 0.544 to 0.572, by 0.029, while the gap in rupees widened from Rs 1,200 to Rs 1,553 a person a month, by 29%.2 By our test that is ratio-only. Rural spending caught up in proportion and fell further behind in money.
The second is the overlap in the other direction. The rural households in the 40th to 60th percentiles, the rural middle, spent Rs 3,498 and Rs 3,866 per person a month in 2023-24. That is about what the urban 10th to 20th percentile spent, at Rs 3,687.27 These are averages within bands, not cut-offs, but the meaning is plain: the median rural household spends like a household near the bottom of urban India.
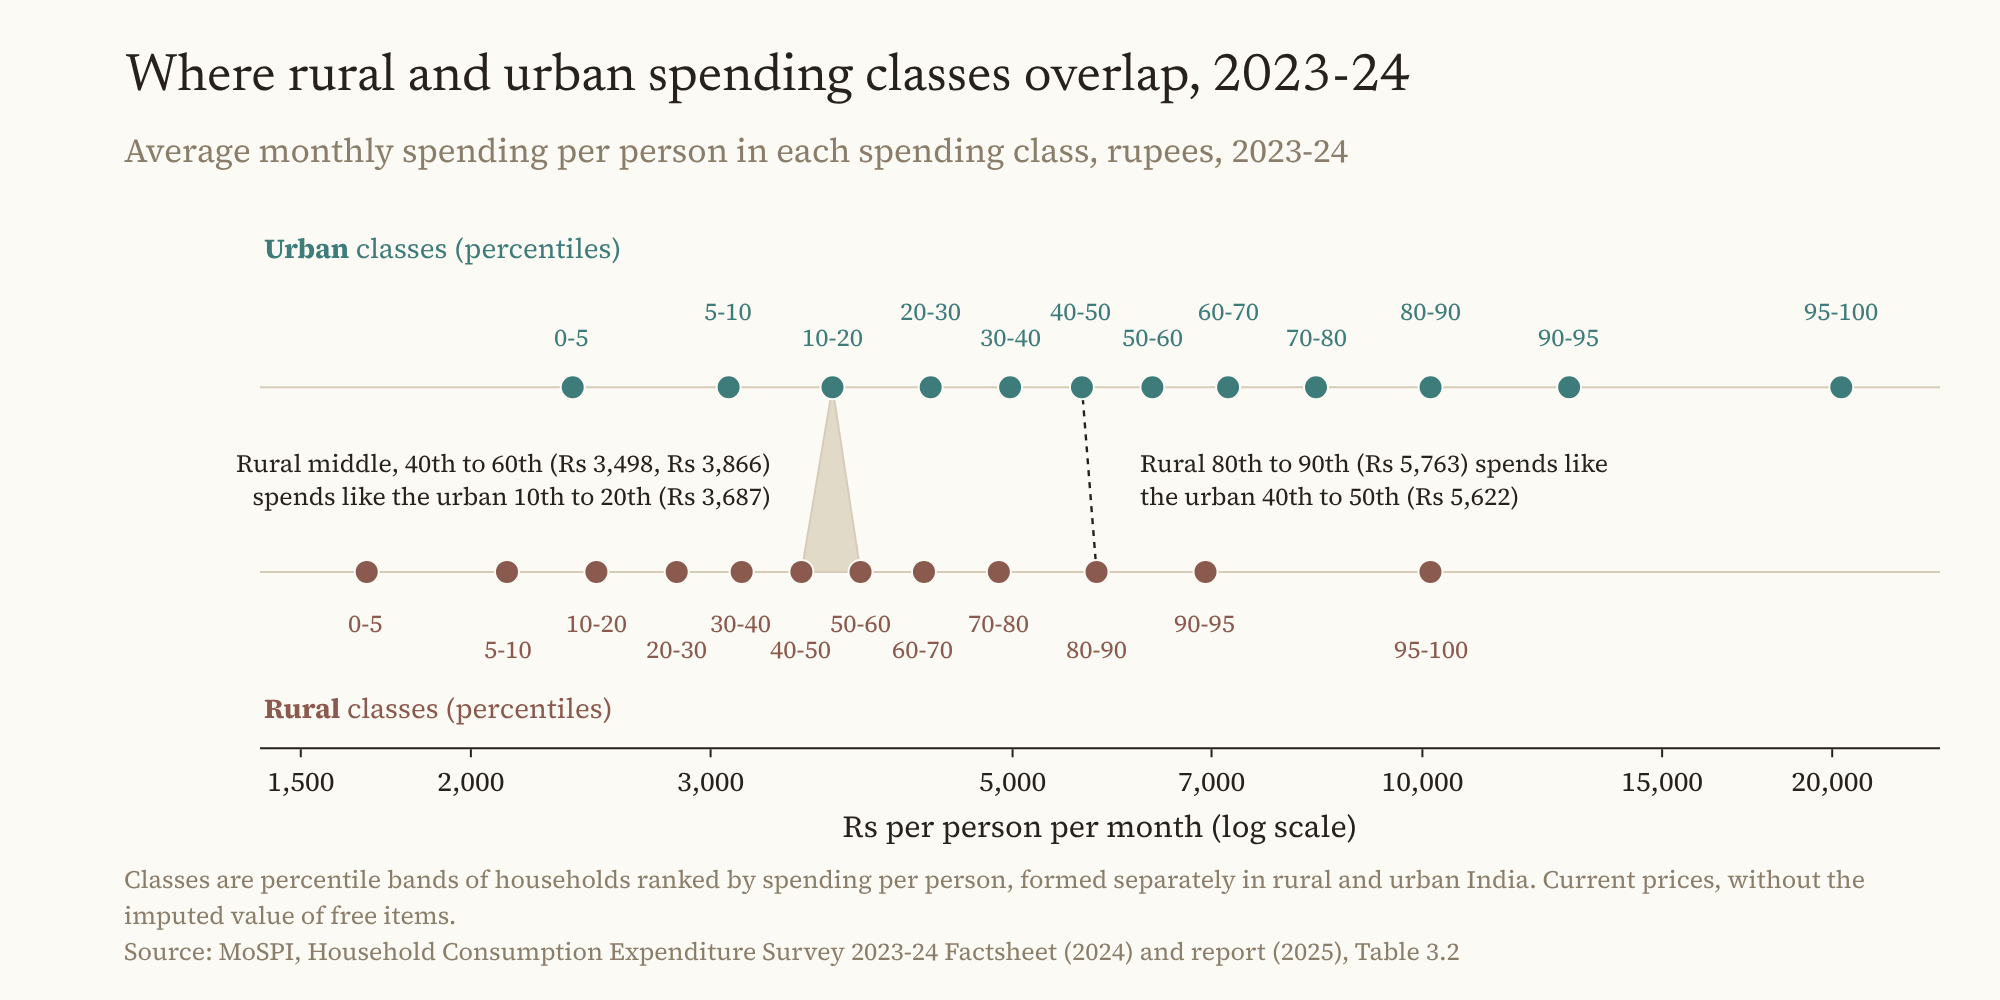
Spending per person on a log scale. The chart marks two overlaps: rural households in the 80th to 90th percentile spend about as much as the urban 40th to 50th, and the rural middle (40th to 60th) about as much as the urban 10th to 20th. A third is not marked: the top 5% of rural households (Rs 10,137) spend about as much as the urban 80th to 90th percentile (Rs 10,139). Classes are formed separately within rural and urban India, at current prices, ignoring rural-urban differences in price levels. Source: MoSPI, Household Consumption Expenditure Survey 2023-24 Factsheet (2024) and report (2025), Table 3.2.
The third is the goods that tell households apart. Rural refrigerator ownership rose from 9.4% to 33.2%, but urban ownership rose from 43.8% to 68.1%, so the gap in points barely moved, from 34.4 to 34.9.11 For washing machines the gap widened, from 18.4 points to 29.4, and for air conditioners or coolers it went from 17.6 to 18.5.11 Computers stayed rare in rural homes: 2.3% in 2023-24 against 15.9% in urban ones.11 A different survey points the same way for cars: in NFHS-5 (2019-21), on the Census definition, 4.4% of rural households owned one against 13.8% of urban households.28 (The appendix figures for washing machines, air conditioners or coolers and computers were read from the paper's charts.)
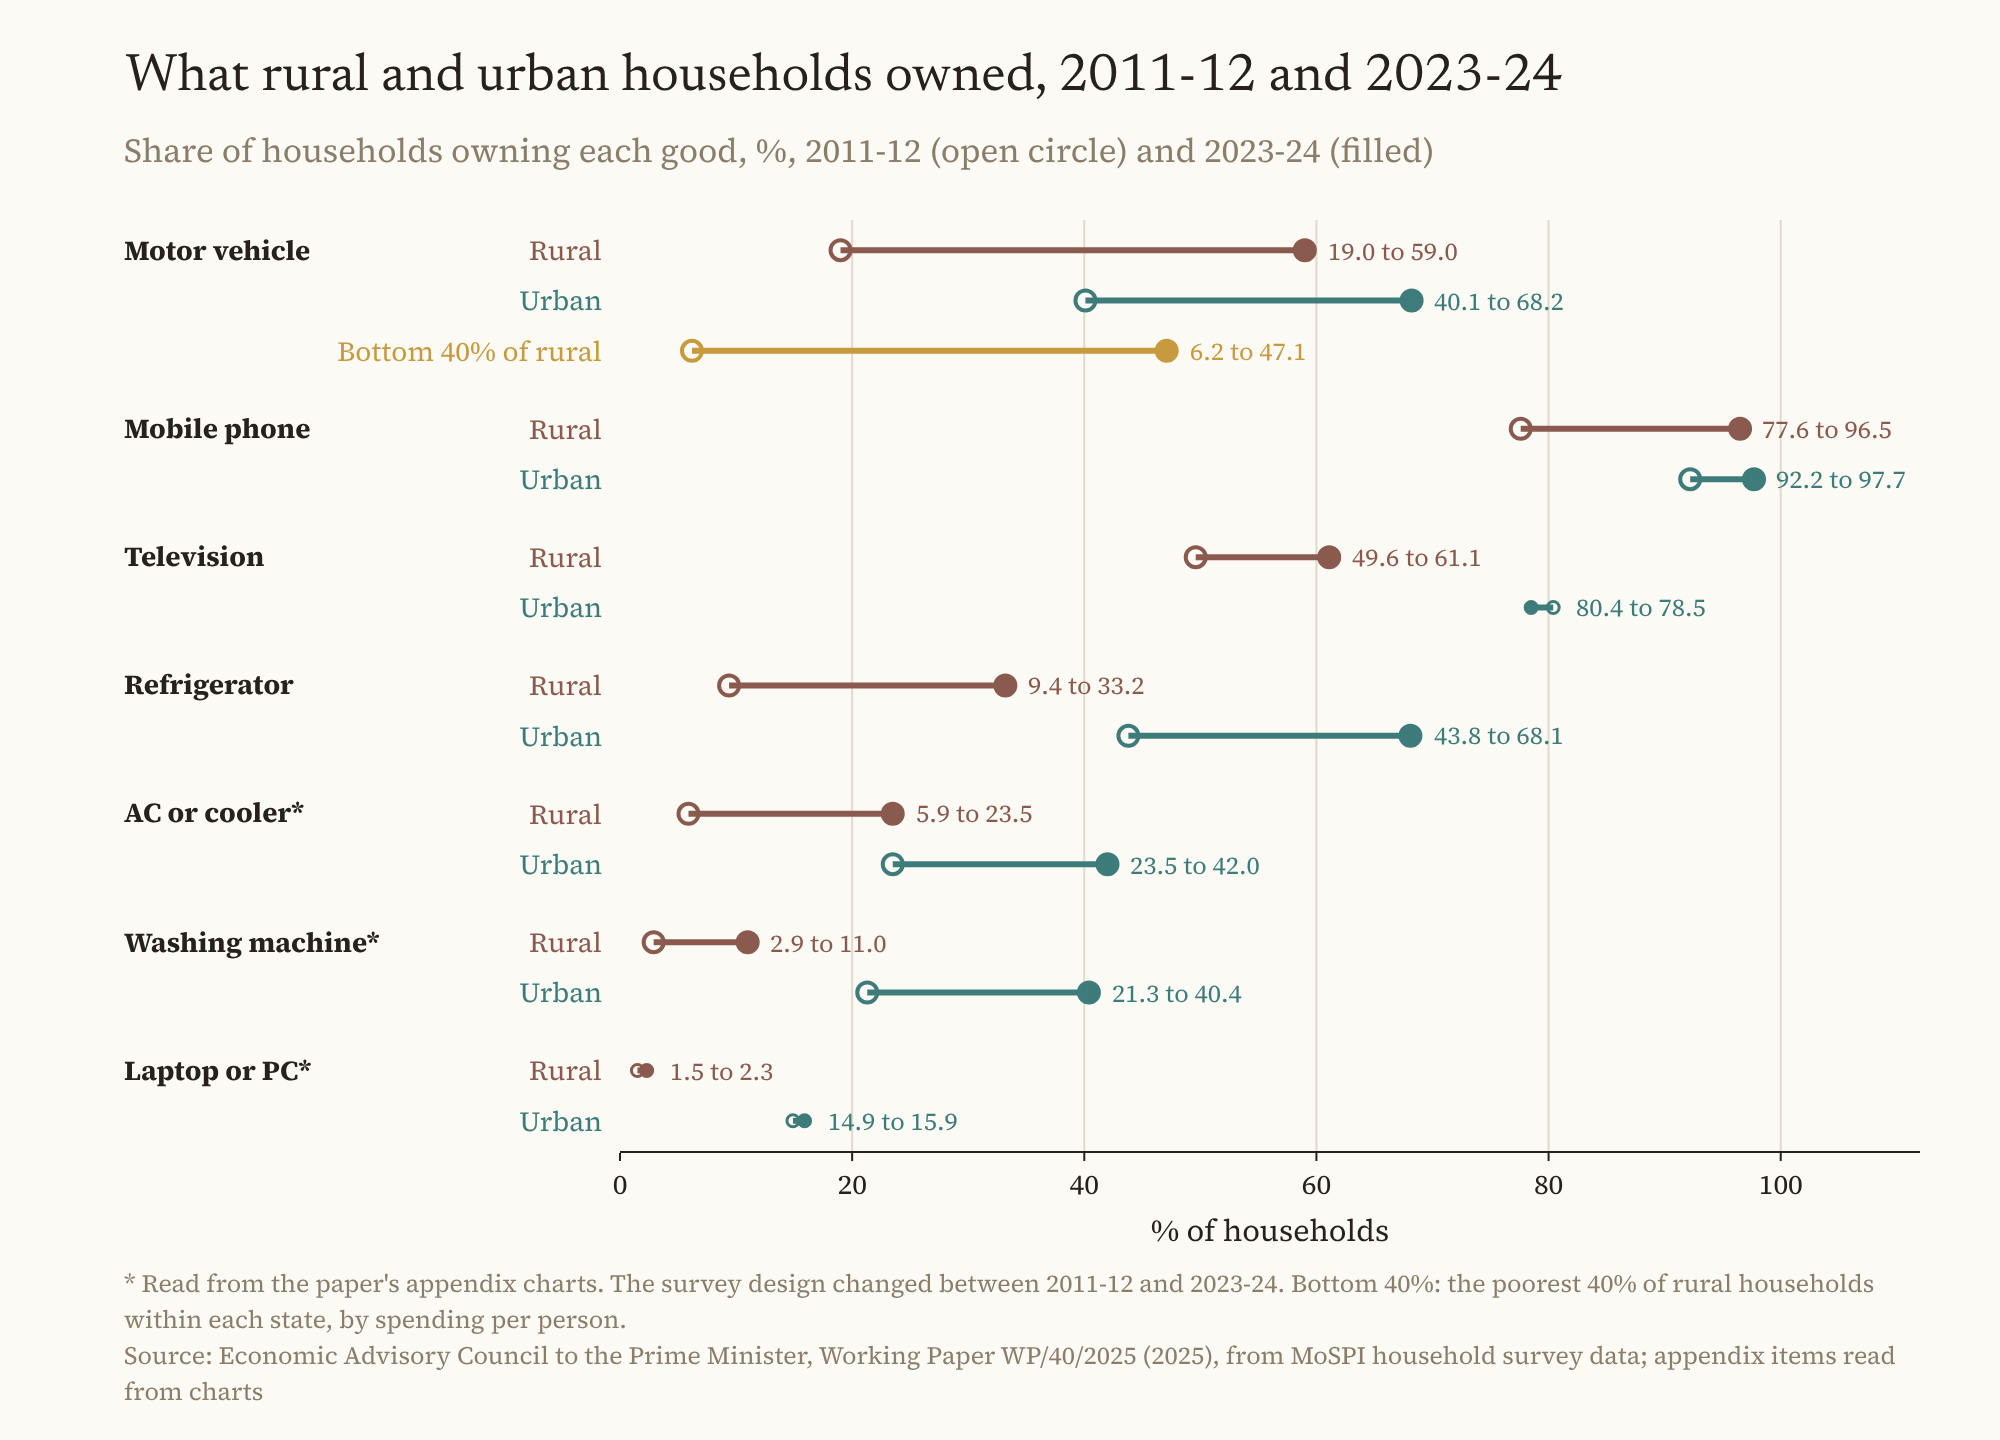
Phones converged and motor vehicles moved most of the way; refrigerators, washing machines and computers did not. The bottom 40% of rural households (within each state) went from 6.2% to 47.1% owning a motor vehicle. The survey design changed after 2011-12. Source: Economic Advisory Council to the Prime Minister, Working Paper WP/40/2025 (2025), from MoSPI household survey data; appendix items read from charts.
The fourth is the survey itself. The 2011-12 survey used about 347 items on one questionnaire in one visit, recorded on paper. The 2022-23 and 2023-24 rounds used 405 items across three questionnaires over three monthly visits, recorded on tablets.2 Changes of this kind can alter what a survey measures. MoSPI does not say how much of the change between 2011-12 and 2023-24 is due to the design.2
Schooling shows the levels gap in another form. In April to June 2025, the average course fee per student was Rs 3,979 in rural areas against Rs 15,143 in urban ones.30 Rural families spend far less than urban ones on what shapes the next generation's earnings.
Reaching the Same Things
Access is where the rural-urban line has faded most. The figures in this section come from MoSPI's NSS surveys and the National Family Health Survey (NFHS), which use the Census definition, and from administrative data where stated. Unlike earlier rounds, NFHS-6 drew its urban sample from MoSPI's Urban Frame Survey blocks rather than Census blocks.31
In January to March 2025, MoSPI's telecom survey found that 82.1% of rural households had at least one smartphone, against 91.3% of urban households, and 83.3% had internet access at home against 91.6%.1 The smartphone ratio is 0.899, a fraction under our 0.90 threshold for "converged", and that one quarter is the only observation; the 9.2-point gap is the better guide. Among 15 to 29 year olds, 92.7% of rural and 95.7% of urban young people had used the internet in the previous three months.1 In 2017-18 the nearest earlier figures, on a narrower 30-day question, were about 25% and 58%.32 The two surveys are not comparable, but the order of change is not in doubt.
Physical access has moved as well. Rural feeders supplied power for 12.5 hours a day on average in 2014 and 22.6 hours in 2024-25, against 22.1 and 23.4 hours for urban feeders, on the Ministry of Power's administrative data.33 In the NFHS of 2023-24, whose results are still provisional, 97.8% of the rural population lived in households with electricity, against 99.5% of the urban population.31 The first phase of the rural roads programme had connected 99.7% of the habitations sanctioned under it by July 2025.34 The government reports that 99.92% of villages had a banking outlet within 5 km in March 2026.35 Among women aged 15 to 49, 89.3% in rural areas had a bank account they used themselves, slightly above the urban 88.3%, again on the provisional NFHS figures.31
What has not closed is individual ownership and skill, and those gaps run along gender as much as geography.
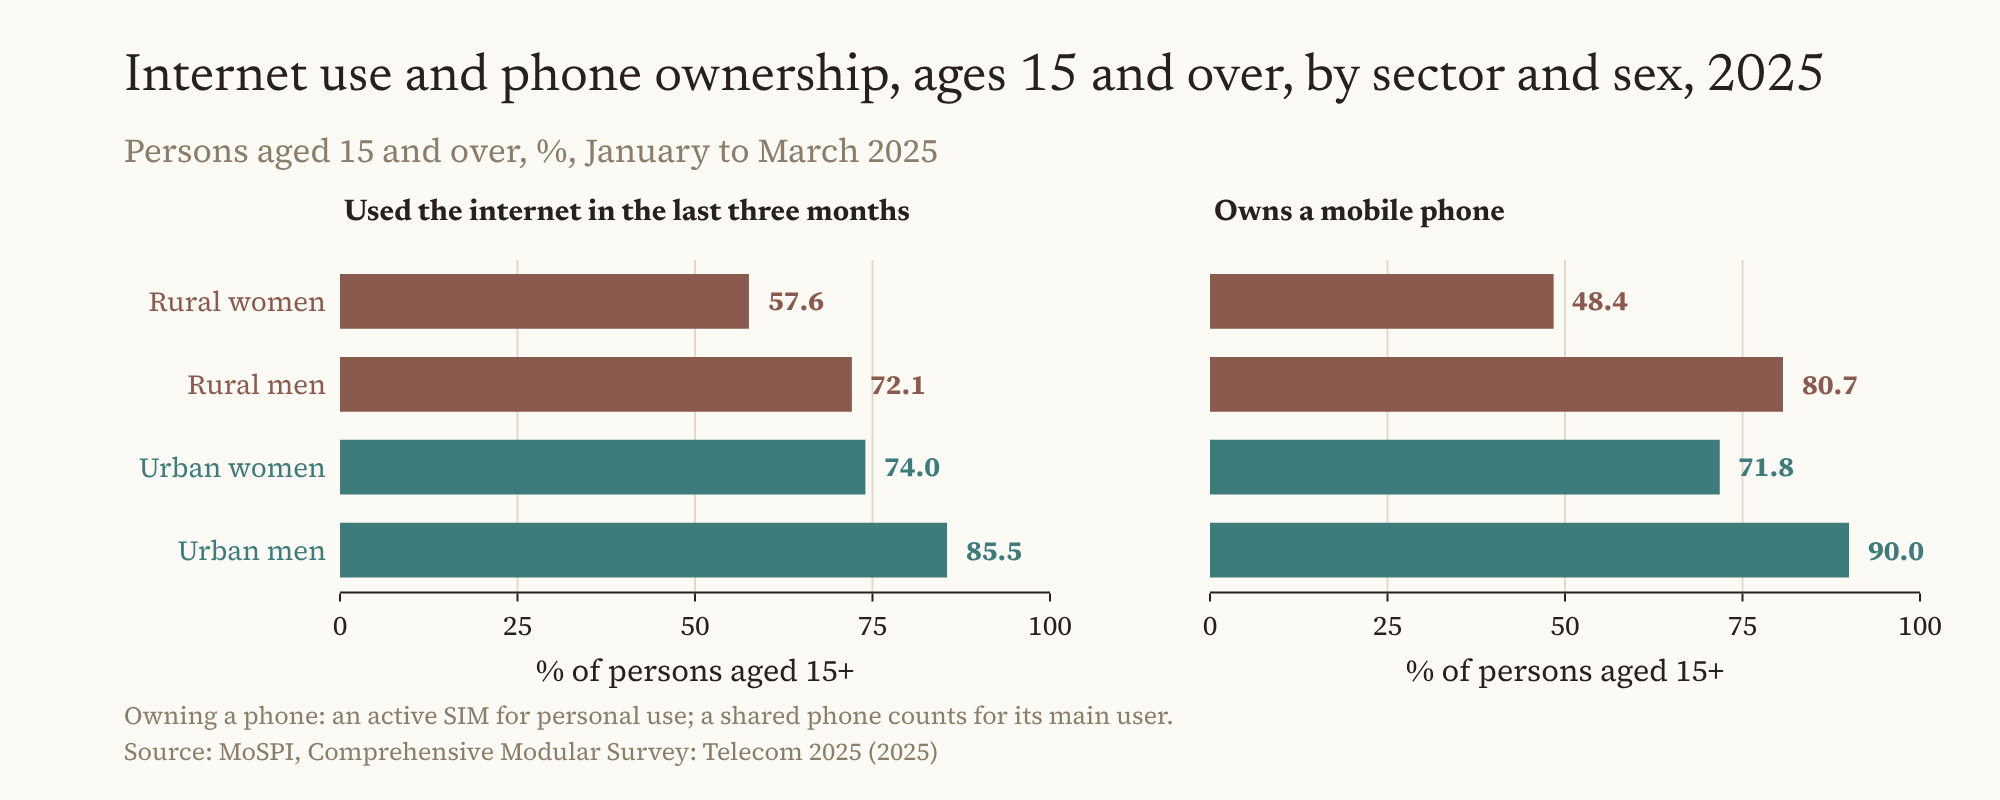
Rural men use the internet at almost the same rate as urban women. The gap between rural men and rural women in owning a phone (32.3 points) is far larger than the gap between rural and urban men (9.3 points). Source: MoSPI, Comprehensive Modular Survey: Telecom 2025 (2025).
In early 2025, 72.1% of rural men aged 15 and over had used the internet in the previous three months, against 57.6% of rural women, 85.5% of urban men and 74.0% of urban women.1 Rural men, in other words, were close to urban women. Phone ownership showed a sharper split: 80.7% of rural men owned a mobile phone, against 48.4% of rural women and 71.8% of urban women.1 By our arithmetic, the gap between rural men and rural women is 32.3 points; the gap between rural and urban men is 9.3.
Skills follow the same pattern. Among 15 to 29 year olds, the share who said they could carry out an online banking transaction rose from 33.3% in rural areas and 56.3% in urban areas in 2022-23 to 63.4% and 79.7% in early 2025.36 37 The gap narrowed from 23.0 points to 16.3, but the two surveys may not have asked the question in the same words, so the trend is indicative. In 2022-23, only 20.2% of rural women in that age group said they could.36 Of rural young people who could bank online in 2025, 99.6% could use UPI, by our addition of MoSPI's categories, which implies that about 63% of rural 15 to 29 year olds can transact on UPI, by our arithmetic.37 This is self-reported ability, not use, and MoSPI did not test it.37
How much rural India actually pays digitally is unknown: the RBI's payment system report gives no rural or urban split of UPI transactions, and we found no measured figure elsewhere.38
Earning a Living Is Still Different
Men leave the farm slowly; women arrive
The worker half of the argument needs care, because the headline number hides two movements in opposite directions. All figures here are PLFS, usual status, NSS rural sector, for July to June years unless stated.
Agriculture's share of all rural workers was 59.4% in 2017-18 and 59.8% in 2023-24.6 5 Alone, that suggests nothing moved. Split by sex, the picture changes. The farm share of rural male workers fell from 55.0% to 49.4%, a drop of 5.6 points, while the farm share of rural female workers rose from 73.2% to 76.9%.6 5 The fall for men was not steady: their farm share was 55.4% in 2019-20 and 53.8% in 2020-21 before it dropped below 50%.6 39 Over the same years, the labour force participation rate of rural women rose from 24.6% to 47.6%.7 The flat total is rural women entering farm work, not rural men staying in it.
Where rural men went matters for pay. Construction employed 17.7% of rural male workers in 2023-24,5 and the research institute ICRIER estimates from PLFS data that it absorbed nearly 40% of new rural male workers since 2018, across the survey's redesign.40 A building site is a change of sector, not necessarily better pay.
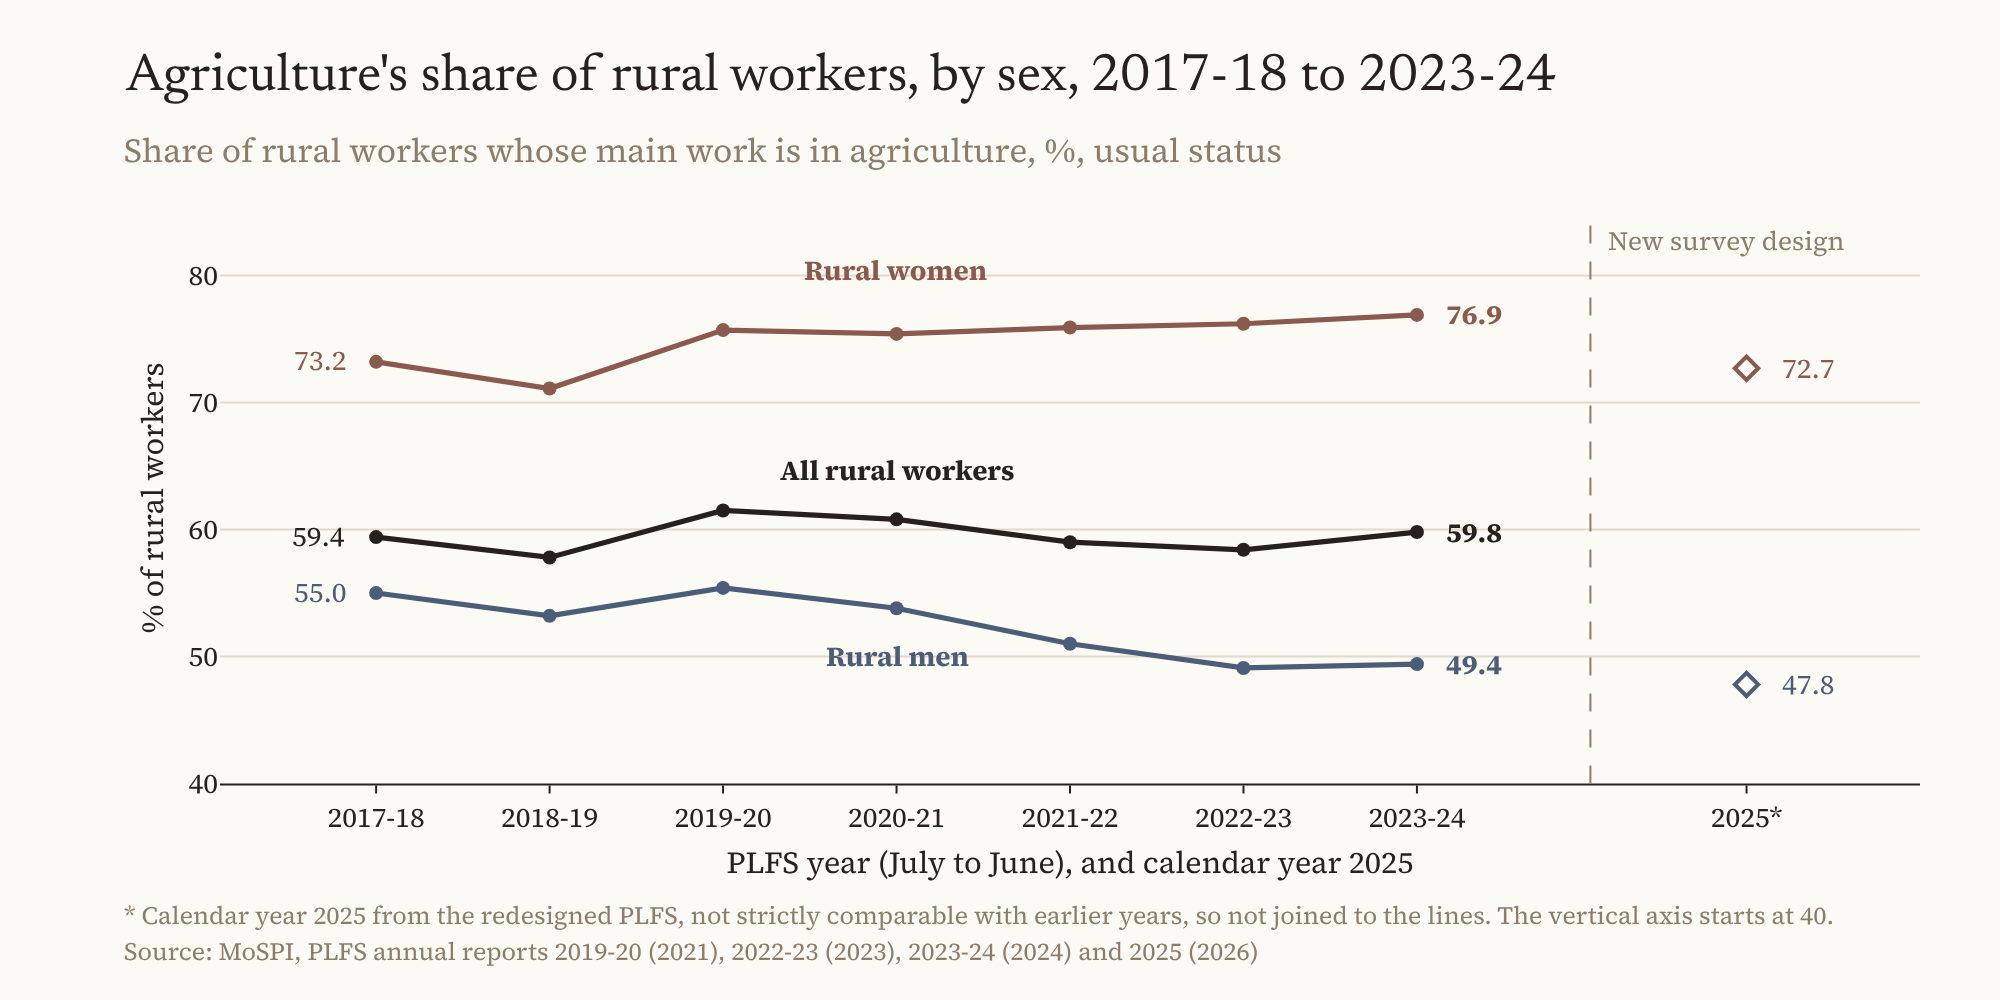
Rural men moved slowly out of farming while rural women, whose participation nearly doubled, moved into it. The total barely changed. The 2025 calendar-year figures (men 47.8%, women 72.7%) come from a redesigned survey and are shown as separate markers, not joined to the lines. The vertical axis starts at 40. Source: MoSPI, PLFS annual reports 2019-20 (2021), 2022-23 (2023), 2023-24 (2024) and 2025 (2026).
Much of women's new work is unpaid. Helpers in household enterprises, who work in a family farm or business without a wage, rose from 38.7% of rural women workers in 2017-18 to 42.3% in 2023-24, while own-account workers rose from 19.0% to 31.2%.6 5 Applying those shares to the rise in rural women's worker population ratio, from 23.7% to 46.5%, helpers account for roughly 46% of the increase in rural women's work and own-account workers for roughly 44%, by our approximate arithmetic: close to half of it is unpaid family work.5 The share of rural women workers in regular salaried jobs fell from 10.5% to 7.8%; in urban India it was 49.4% in 2023-24.6 5 For rural men, regular salaried jobs rose from 14.0% to 15.8% of workers, against 46.8% for urban men.6 5 On our test, rural men's ratio rose by 0.031 while the gap stayed at about 31 points, which is ratio-only; rural women's ratio fell.
On the redesigned survey for calendar 2025, rural men's farm share was 47.8%, rural women's 72.7%, the rural women's helper share 32.9% and rural men's regular-job share 17.0%. MoSPI warns that "the annual estimates for 2025 may not be strictly comparable with those presented in the previous annual reports".41 They point in the same direction for men; whether the fall in the helper share is a change in women's work or in the survey cannot yet be said.41
Migration is harder to read. The latest official survey of it, the PLFS of 2020-21, was taken during the pandemic. It found that 18.9% of all migrants had moved from a rural to an urban area, but migrants as a whole are dominated by women who moved for marriage: women's migration rate was 47.9% against 10.7% for men, and 86.8% of women migrants gave marriage as the reason. Among men, a third of migrants had moved from village to town, and about four in ten had moved for work or to look for it.42
The pay gap widened for wage workers
If rural households were converging as earners, rural pay would be catching up with urban pay. For wage workers it is not. The PLFS reports average earnings for rural and urban workers each quarter on the current weekly status, in nominal rupees. Rural figures come from the first visit to each household and urban figures from the first visit and revisits, so the two sides are not collected in quite the same way.5 The PLFS is the only official survey that reports rural and urban earnings side by side, and we found no independent series to check it against.
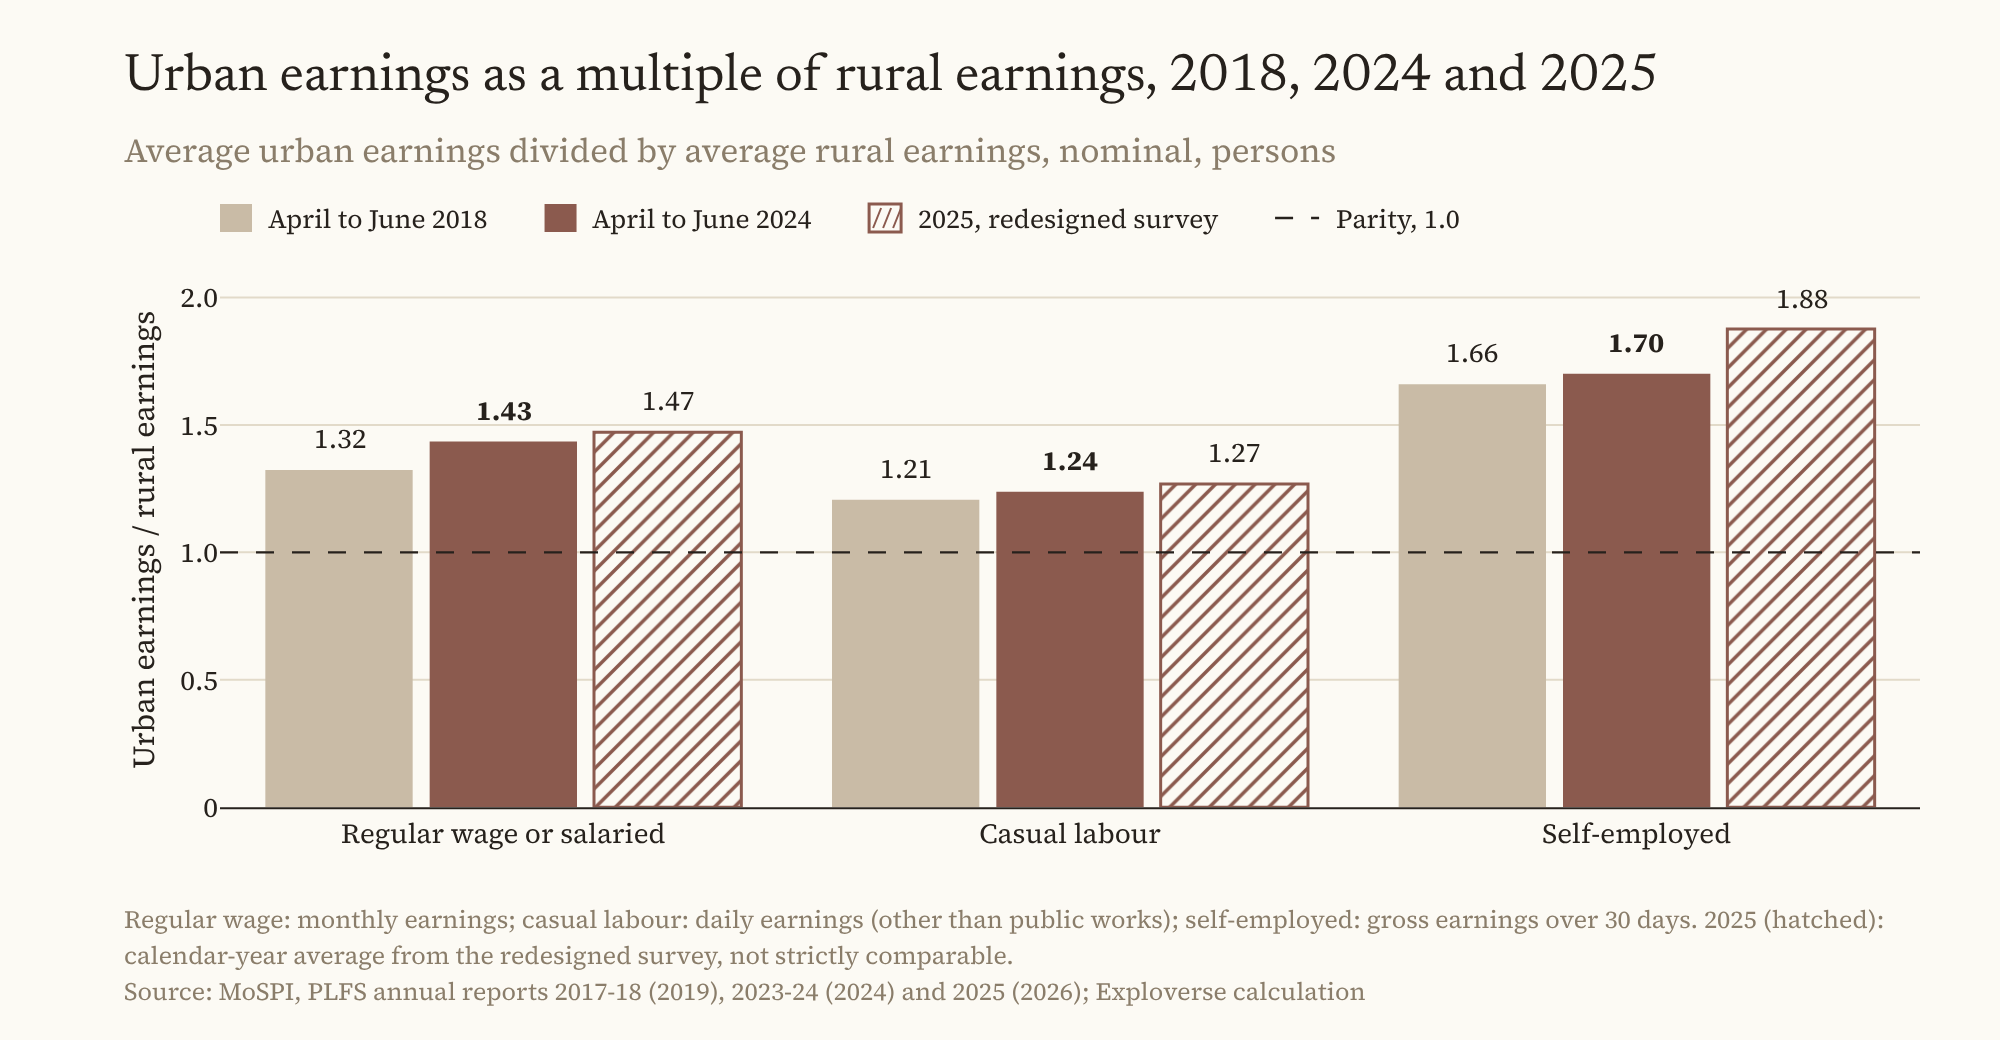
For regular wage and casual work, urban earnings rose further ahead of rural earnings between April to June 2018 and April to June 2024, as they did in every other quarter we compared. The self-employed ratio widened in this quarter but was flat on a four-quarter average. Ratios are urban divided by rural. The hatched 2025 bars are calendar-year averages from a redesigned survey and are not strictly comparable. Rural earnings come from first visits only, urban from first visits and revisits. Source: MoSPI, PLFS annual reports 2017-18 (2019), 2023-24 (2024) and 2025 (2026); Exploverse calculation.
For regular wage and salaried workers, urban earnings were 1.32 times rural earnings in April to June 2018 and 1.43 times in April to June 2024, by our arithmetic.4 5 Over those six years, average rural regular earnings rose by 29% in nominal terms and urban by 40%. For casual labourers, the ratio went from 1.21 (Rs 316 against Rs 262 a day) to 1.24 (Rs 516 against Rs 417). One quarter can mislead, so we compared each quarter of 2017-18 with the same quarter of 2023-24. For regular and casual work the ratio widened in all four; averaged over the four quarters, it rose from 1.36 to 1.44 for regular work and from 1.23 to 1.26 for casual work, by our arithmetic.4 5
The self-employed are different. Their ratio widened in April to June, from 1.66 (Rs 14,878 against Rs 8,963 for 30 days) to 1.70 (Rs 20,413 against Rs 12,001), but it narrowed in two other quarters. Averaged over the four quarters it did not change: 1.755 in 2017-18 and 1.756 in 2023-24, by our arithmetic.4 5 Rural self-employed earnings did not fall further behind, and they did not catch up.
The 2025 report adds calendar-year figures. On the old design, the regular-pay ratio fell from 1.49 in 2022 to 1.45 in 2024, while the casual ratio rose from 1.23 to 1.26 and the self-employed ratio from 1.64 to 1.77, by our arithmetic; 2022 was a low year for the self-employed, and by 2024 their ratio was back near its 2017-18 level. On the redesigned 2025 survey, which is not strictly comparable, the three ratios were 1.47, 1.27 and 1.88.41
The timing matters. The spending gap narrowed between 2011-12 and 2022-23, with no observation in between and across a change in survey design; the earnings comparison starts in 2017-18. The two surveys cannot show that the movements happened at the same time. They overlap only in the last two survey years. MoSPI's two recent spending surveys ran from August to July, so the nearest PLFS figures are for calendar 2023 and 2024, and in that window neither gap moved much. The spending gap was 71% and then 70% at current prices, and 75% in both years at 2011-12 prices,3 2 while the urban-to-rural earnings ratios barely changed: 1.46 to 1.45 for regular work, 1.26 in both years for casual work and 1.76 to 1.77 for the self-employed, by our arithmetic.41 The surveys also measure different things: earnings per worker, spending per person across a household. A household's spending can gain on urban households while each worker's pay lags, if more of its members earn, as rural women increasingly do, or if it receives more free food and goods from government schemes, which narrow the 2023-24 spending gap from 70% to 67%.3
Where rural income comes from
Rural incomes have diversified, on evidence from surveys with different definitions that must be read separately.
NABARD's rural financial inclusion survey (NAFIS) covers centres with fewer than 50,000 people, so it includes small towns, and it leaves out transfers and remittances.14 On that definition, average monthly household income rose from Rs 8,059 in 2016-17 to Rs 12,698 in 2021-22, by 57.6% in nominal terms, though NABARD notes that the 2021-22 round covered more districts and households.43 In 2021-22, government or private service accounted for 37% of household income, cultivation for 20%, wage labour for 20%, other enterprises for 15% and livestock for 7%.14 Even in agricultural households, cultivation was 33% of income.14
The NSS survey of agricultural households, which covers only rural households with farm output above a threshold, shows the same drift. For those households, wages made up 39.8% of income in 2018-19 and crops 37.2%; Bakshi calculated that real income from wages rose 42.6% from 2012-13 while real income from crops fell 10.4%, comparing two rounds on slightly different definitions.44
Neither survey can be set against the PLFS job figures. That 37% of NAFIS income comes from salaried service does not mean that rural people hold salaried jobs at anything like that rate.
Remittances are the missing piece. The last official national estimate is from 2007-08, when 30.4% of rural households, on the NSS definition, had a member who had migrated, and 36.5% of those received remittances, averaging about Rs 20,700 a year.45 By our arithmetic, about 11% of all rural households received remittances then. No later official figure was found.
Wealth and credit
The wealth gap is wider than the spending gap. In MoSPI's All India Debt and Investment Survey, which uses the NSS rural sector, average household assets on 30 June 2018 were Rs 15.92 lakh in rural India and Rs 27.17 lakh in urban India, a ratio of 0.59 by our arithmetic.46 Institutional lenders such as banks and cooperatives held 66% of rural household cash debt against 87% of urban debt, and 35.0% of rural households were in debt against 22.4% of urban ones.46
On the RBI's definition of rural, branches in centres under 10,000 people held about 10% of bank credit in both March 2016 and March 2026: 9.8% and 9.6%, by our arithmetic from the RBI's tables.47 Banking reach has spread; the rural share of bank credit has not.
The output gap is older still. NITI Aayog's analysis of CSO data gives the last available rural-urban split of national output, for 2011-12: rural areas, on the Census definition, produced 46.9% of net domestic product, and output per worker in urban areas was 2.78 times that in rural areas, by our arithmetic.48 In 2025, agriculture employed 43.0% of all Indian workers, and in 2025-26 it produced an estimated 17.9% of gross value added, by our arithmetic from MoSPI's national accounts.49 50
What roads did
The best causal evidence on rural change comes from the national rural roads programme. Asher and Novosad studied 11,432 villages in six states that were close to the population thresholds for getting a road, which lets them compare villages that got roads with similar villages that did not.51 About four years after the road arrived, the share of workers in agriculture fell by 9.2 percentage points, about 19% of the average in comparison villages. But predicted consumption, which they imputed from household assets, income and land, rose by only 2.2%, a change they could not distinguish from zero, and they could rule out a rise of 10% with 95% confidence. They found no effect on farm mechanisation or irrigation, and none on assets, though assets feed the consumption measure, so that is not a separate finding.51
At village level, the order was the reverse of the national pattern this article describes: work moved, and spending did not follow within about four years. A change in how people work need not quickly raise living standards.
The rural wage series
The Labour Bureau's rural wage series changed in 2025, and nothing in this article relies on it after mid-2025. The series moved from a sample of 600 villages in 20 states to 787 villages in 34 states and union territories, and its all-India average weights every village wage quote equally, so changing which states are sampled changes the average directly.52 At about the same time, in mid-2025, the consumer price index for agricultural and rural labourers, the usual deflator for rural wages, was rebased from 1986-87 to 2019, and the release gave no linking factor.53 We found no published bridge between the old and new series, so we make no claim about real wage growth across that break.
Before the break, the record is weak growth. Das and Usami, analysing the Labour Bureau series in a peer-reviewed journal, found real wage growth of under 1% a year for most rural occupations between 2014-15 and 2022-23, and negative growth from 2019-20.54
A Farm Changing Its Methods
Mechanisation is one indicator among several of how rural work is changing, and an informative one, because it shows capital replacing labour on the farm. The evidence here is from government and parliamentary sources.
The Standing Committee on Agriculture reported in 2023 that farm power available per hectare rose from 0.36 kW in 1975-76 to 2.49 kW in 2018-19, and tentatively to 2.54 kW in 2021-22, against a target of 4.0 kW by 2030.55 Human and animal power fell from 60.8% of farm power in 1971-72 to 10.1% in 2012-13, as Chart 8 shows.55
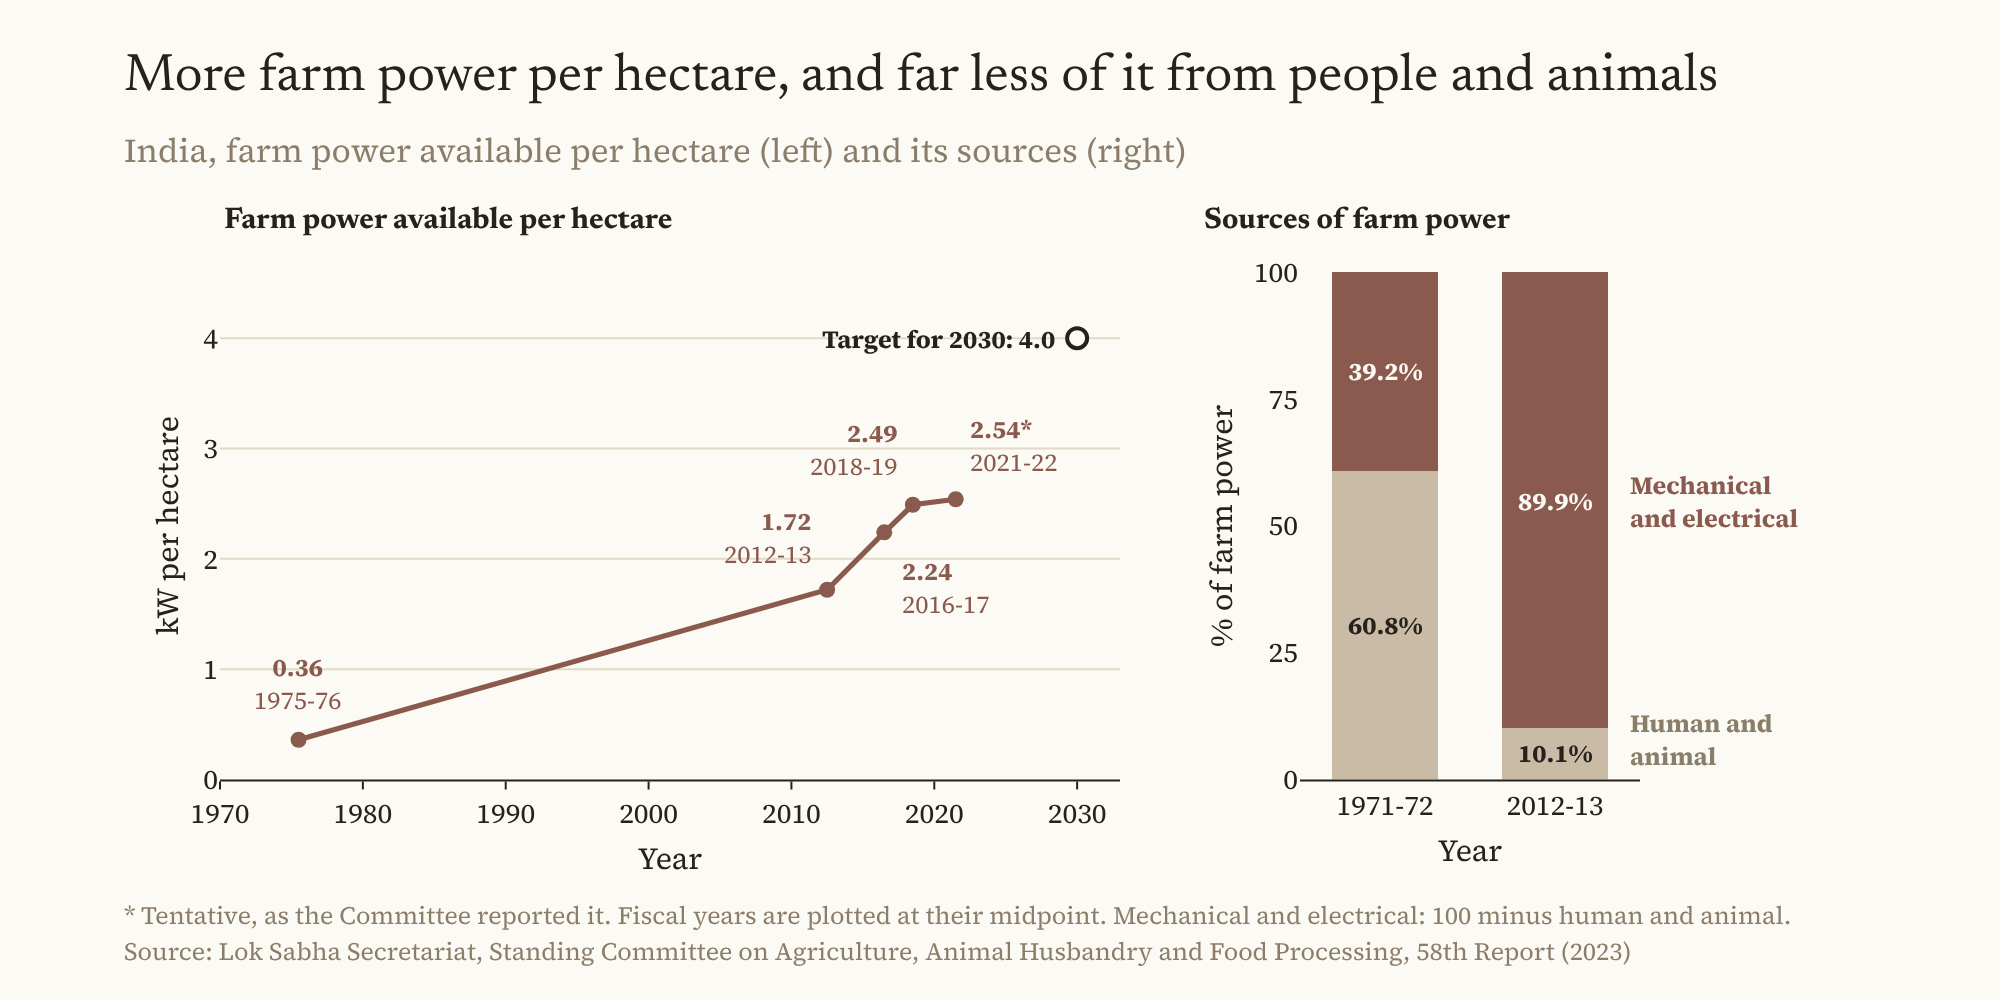
Farm power available per hectare rose from 0.36 kW in 1975-76 to 2.49 kW in 2018-19 and, tentatively, 2.54 kW in 2021-22, still below the target of 4.0 kW for 2030. Human and animal sources fell from 60.8% of farm power in 1971-72 to 10.1% in 2012-13. Source: Lok Sabha Secretariat, Standing Committee on Agriculture, Animal Husbandry and Food Processing, 58th Report (2023).
On the cost of cultivation data analysed by Srivastava and co-authors, labour used per hectare across ten crops fell from 701 hours in 1993-94 to 555 in 2016-17.56 The government's support scheme had funded 52,173 custom hiring centres, hubs and farm machinery banks by January 2025, which let farmers rent machines instead of buying them.57
The limits are as clear. The committee put overall mechanisation at 47% in 2022, without stating its method; Chart 9 shows 70% for seedbed preparation but 38% for sowing and about a third for weeding, plant protection, harvesting and threshing.55 By crop, wheat (69%) and rice (53%) led; pulses, oilseeds, cotton and sugarcane were at 41% or less.55 It said reaching 75% to 80% would take "another 25 years".55
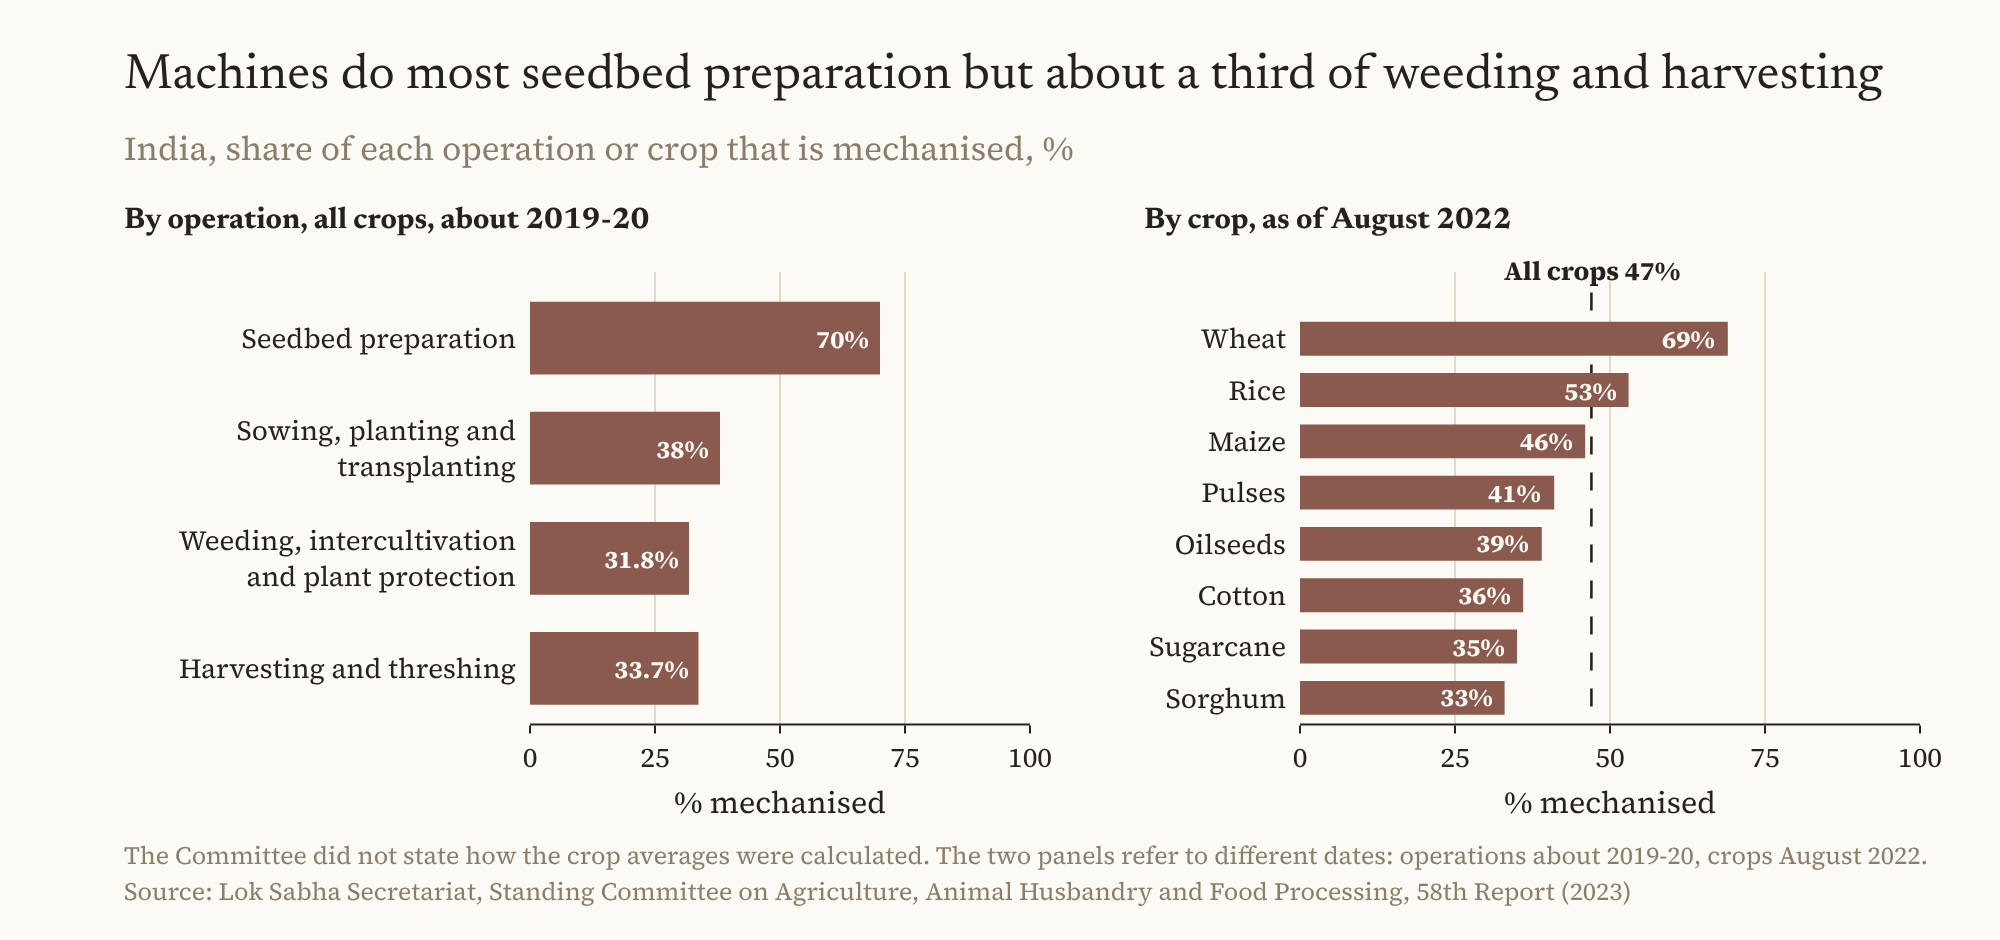
Mechanisation is highest at the start of the crop cycle and lowest in weeding, plant protection and harvesting; by crop it is highest for wheat and rice, against an all-crop figure of 47%. The two panels refer to different dates, and the Committee did not state how the crop averages were calculated. Source: Lok Sabha Secretariat, Standing Committee on Agriculture, Animal Husbandry and Food Processing, 58th Report (2023).
Holdings are small: the average operational holding fell from 2.28 hectares in 1970-71 to 1.08 in 2015-16, and small and marginal farmers hold 86% of holdings but 47% of the area.58 55 Small holdings make owning a machine harder to justify, which, we infer, is why the government's scheme has funded hiring centres alongside individual purchases. And 44.2% of gross cropped area was still unirrigated in 2022-23.59
What farms produce is shifting more than how farm workers are employed. Livestock rose from 25.6% of the value of agricultural output in 2011-12 to 30.9% in 2022-23, while crops fell from 62.4% to 54.3%.60 Asher and Novosad found no change in mechanisation or irrigation in villages that got roads; Aggarwal found that households in villages with new roads adopted more farm technology.51 61 The evidence on whether roads bring machines is mixed. Less labour per hectare is consistent with the slow fall in rural men's farm share, though these sources cannot show that one caused the other. Nor does more machinery on the farm say where the released labour goes, and close to half of the rise in rural women's work since 2017-18 has been unpaid family work. As one indicator, mechanisation says the farm is changing its methods. It does not say the rural economy has stopped depending on the farm.
The Case That Little Has Changed
The strongest objection to this article concerns its consumer half. Here is that case at its strongest.
Start with the measure. The MoSPI figures here use the NSS rural sector. The convergence in spending rests on comparing a 2011-12 survey with surveys that used more items, more visits and tablets, and MoSPI has not said how much of the measured rise is design.2 Allow for the faster rise in rural prices and the gap is 75%, not 70%; in constant rupees it widened by 29%.2 The median rural household spends like a household in the second-poorest tenth of urban India.27 Valuing free government food and goods narrows the gap from 70% to 67%, which shows that such transfers add more to rural than to urban spending.3
Then ownership. Phones are near saturation, and goods near a ceiling converge whatever happens to income; the television gap narrowed partly because urban households gave up their sets.11 The goods that separate a comfortable household from a struggling one, refrigerators, washing machines and computers, show no narrowing in points.
Then the market itself. NielsenIQ's rural packaged-goods volumes fell by 0.8% in January to March 2026 on its measure of offline trade, and by 5.0% in April to June on its measure including e-commerce, when urban volumes on the same measure grew by 0.1%.62 16 The two measures are not one series, and NielsenIQ's rural is places under 10,000 people. NielsenIQ notes that rural volumes stand "at a higher base over long haul", but two quarters of decline are not the behaviour of a market converging on its own momentum.62
Then work and income. Rural pay for regular and casual work fell further behind urban pay in every quarter compared, and self-employed earnings did not catch up.4 5 Rural wages grew by less than 1% a year in real terms for most occupations in the eight years to 2022-23.54 Household assets are 59% of the urban level, institutional lenders hold 66% of rural debt against 87% of urban debt, and the rural share of bank credit has not moved in a decade.46 47
On this reading, rural India has acquired some of the goods of urban India, measured by a survey that may flatter it, while a larger share of its households than of urban ones is in debt, and more of that debt comes from informal lenders. The line between rural and urban means what it always meant.
What survives? The level of access in 2025 survives, because it needs no comparison across surveys, and on that level the gap in young people's internet use has nearly closed. The vehicle gains among poorer rural households cross the same survey change as spending, though owning a vehicle is a yes-or-no question and less exposed to changes in recall periods than spending is; a rise from 6.2% to 47.1% among the bottom 40% of rural households is not a ceiling effect.11 Within one survey, the 2023-24 overlap between the upper rural spending classes and the urban middle needs no comparison across years. What does not survive is any claim that rural India has caught up as an economy. The steel-man leaves the thesis standing in its moderate form and removes any stronger one.
Better Lines Than Rural and Urban
If the rural line explains less than it used to about consumption and access, something else must explain more. Three lines stand out: state, gender and income band.
State first. On the NSS definition, in 2023-24 the urban-rural spending gap was 18% in Kerala and 27% in Punjab, and 80% in Chhattisgarh and 83% in Jharkhand.3 Across the 18 major states in MoSPI's table, that spread of 65 points is wider than the 14-point national fall between 2011-12 and 2023-24, by our arithmetic, though one is a snapshot and the other a change. In Maharashtra, the gap widened from 66% to 78% in a single year.3 Telling a business or a ministry that a household is rural says less about its spending than naming its state.
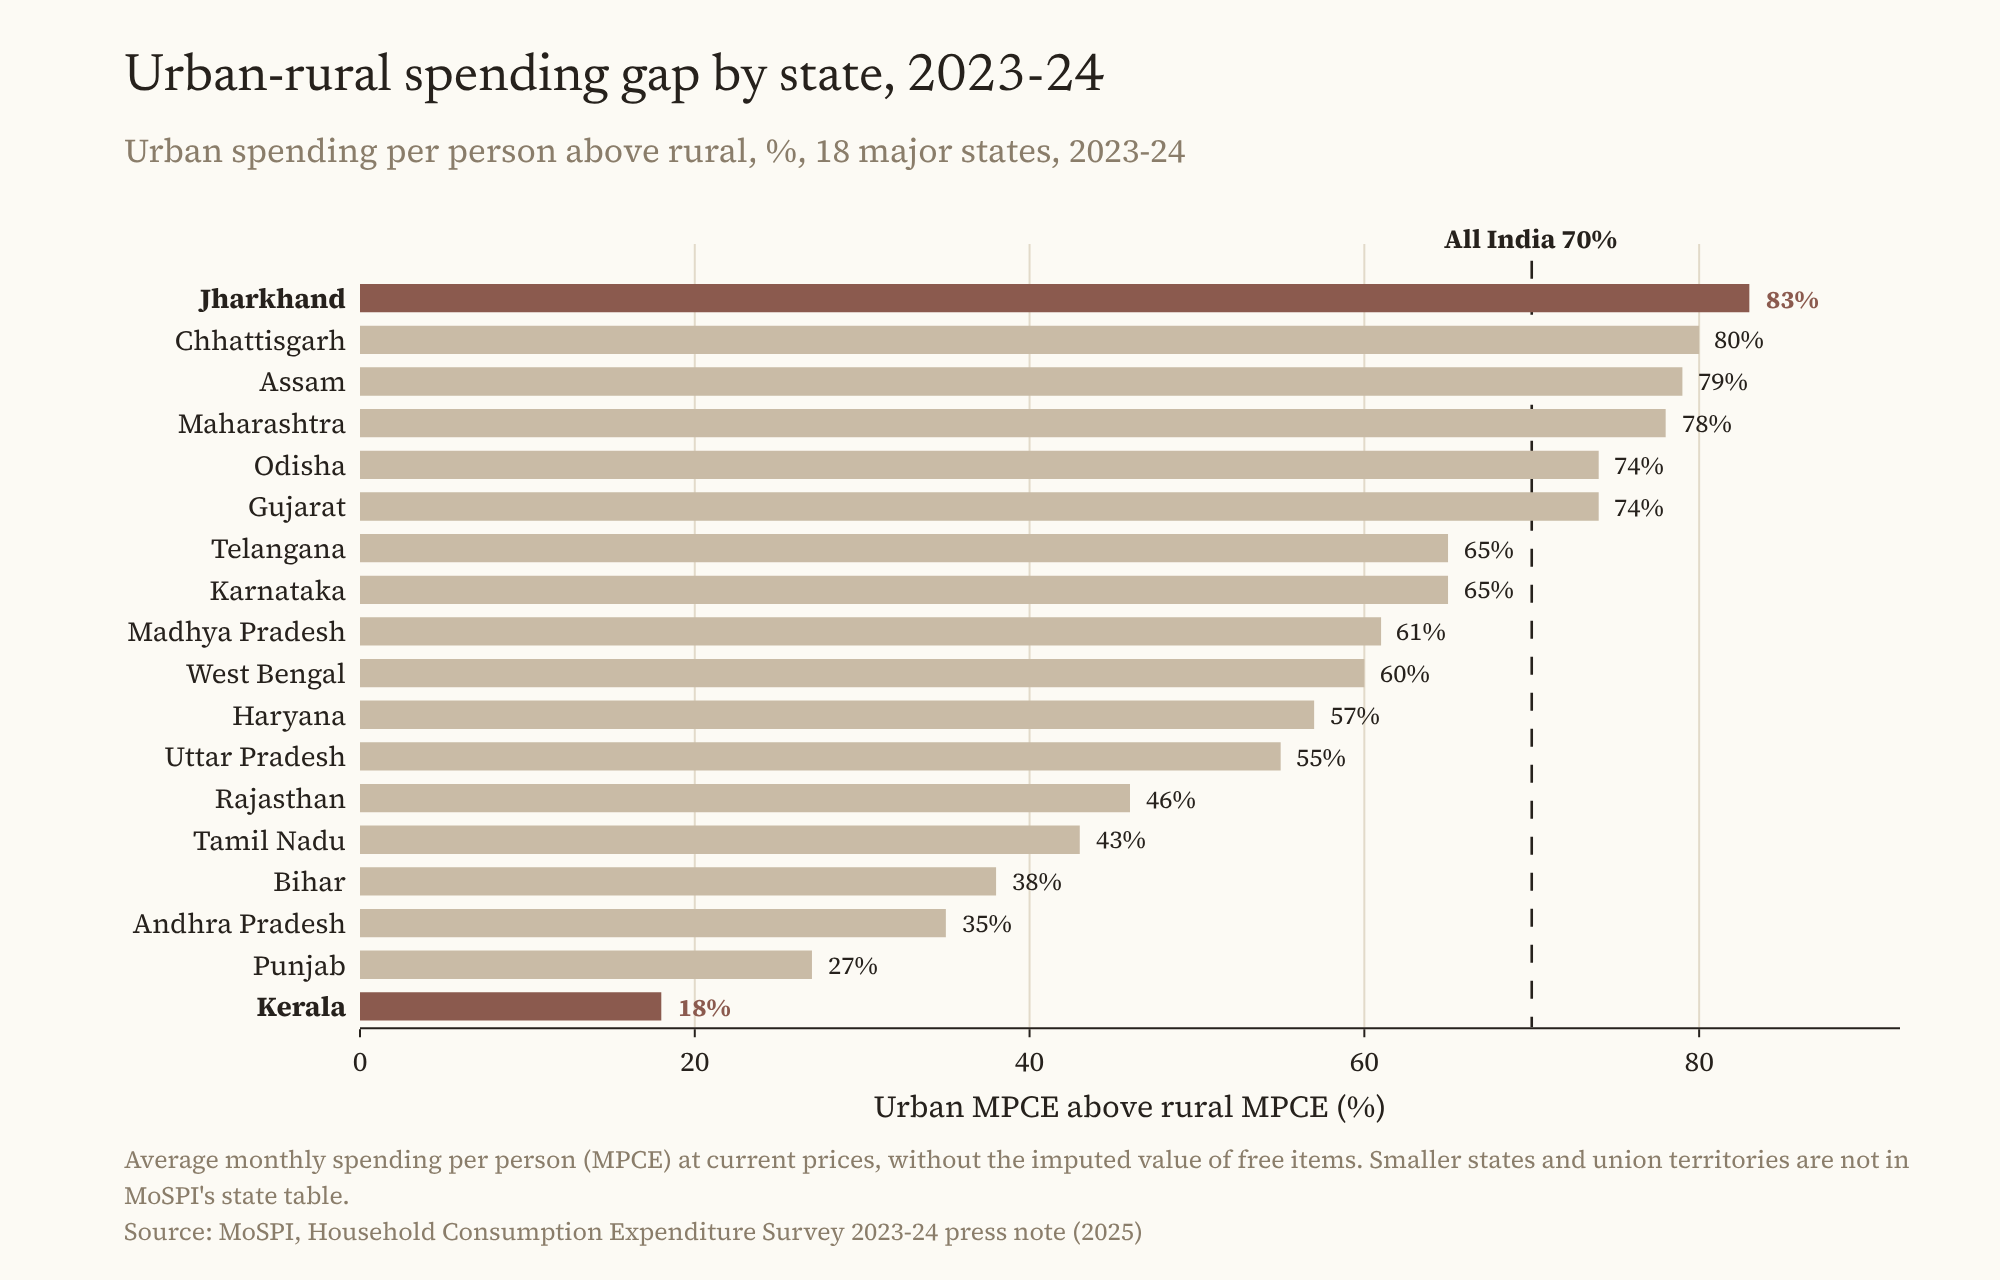
The gap between urban and rural spending per person ranges from 18% in Kerala to 83% in Jharkhand among the 18 major states, a wider spread than the national change over twelve years. Source: MoSPI, Household Consumption Expenditure Survey 2023-24 press note (2025).
Gender second. The rural-urban gap in phone ownership among men, 9.3 points, is smaller than the gap between rural men and rural women, 32.3 points. In a World Bank study, Chatterjee, Murgai and Rama found that once local job opportunities were accounted for, a woman's place on the gradient from small village to large city explained little of whether she worked.63 Income band third: rural households in the 80th to 90th percentile spend about as much per person as the urban middle.
The rural line still carries meaning where this article's thesis says it should: in work, earnings, wealth and the things that build them. Only 61.9% of rural people aged 15 and over had at least secondary education in 2025, on the redesigned PLFS, against 79.7% in urban areas.64 In NFHS-5 (2019-21), which uses the Census line, 48.0% of rural households lived in a pucca house against 84.9% of urban households, and 43.2% used clean cooking fuel against 89.7%.28 On the same survey, rural multidimensional poverty fell faster than urban, from 32.59% to 19.28% against 8.65% to 5.27% between NFHS-4 and NFHS-5, but the rural rate remained more than three times the urban one, by our arithmetic.65
The table below sets the latest official rural and urban figures side by side; the last column is our reading, with earlier figures in brackets where they compare.
| What we compared | Rural | Urban | What it shows |
|---|---|---|---|
| Access | |||
| Households with a smartphone (2025) | 82.1% | 91.3% | Nearly level |
| Ages 15 to 29 who used the internet in the last three months (2025) | 92.7% | 95.7% | Nearly level |
| Women aged 15 and over who own a mobile phone (2025) | 48.4% | 71.8% | Far apart |
| Ages 15 to 29 able to bank online (2025) | 63.4% | 79.7% | Catching up (2022-23: 33.3% and 56.3%; survey wording may differ) |
| Women aged 15 to 49 with a bank account they use themselves (2023-24, provisional) | 89.3% | 88.3% | Level |
| Hours of power supply a day (2024-25) | 22.6 | 23.4 | Nearly level (2014: 12.5 and 22.1) |
| Ownership | |||
| Households owning a motor vehicle (2023-24) | 59.0% | 68.2% | Catching up (2011-12: 19.0% and 40.1%) |
| Households owning a refrigerator (2023-24) | 33.2% | 68.1% | Gap unchanged (2011-12: 9.4% and 43.8%) |
| Households owning a washing machine (2023-24) | 11.0% | 40.4% | Gap wider (2011-12: 2.9% and 21.3%) |
| Spending | |||
| Monthly spending per person at 2011-12 prices (2023-24) | Rs 2,079 | Rs 3,632 | Closer in proportion, further apart in rupees (2011-12: Rs 1,430 and Rs 2,630) |
| Work | |||
| Men workers in farming (2023-24) | 49.4% | 4.8% | Rural share falling slowly (2017-18 rural: 55.0%) |
| Women workers in farming (2023-24) | 76.9% | 12.3% | Rural share rising (2017-18 rural: 73.2%) |
| Men workers in regular salaried jobs (2023-24) | 15.8% | 46.8% | Far apart (2017-18: 14.0% and 45.7%) |
| Women workers in regular salaried jobs (2023-24) | 7.8% | 49.4% | Far apart (2017-18: 10.5% and 52.1%) |
| Pay | |||
| Monthly earnings in regular salaried work (April to June 2024) | Rs 17,033 | Rs 24,434 | Falling behind (April to June 2018: Rs 13,207 and Rs 17,473) |
| Self-employed earnings over 30 days (April to June 2024) | Rs 12,001 | Rs 20,413 | No catching up (April to June 2018: Rs 8,963 and Rs 14,878) |
| Wealth | |||
| Average household assets (June 2018) | Rs 15.92 lakh | Rs 27.17 lakh | Far apart |
Sources as cited in the text. Each survey keeps its own definition of rural: the MoSPI surveys and NFHS follow the Census line, and power supply is reported by feeder class. The ownership and spending comparisons cross a change in survey design. NFHS-6 figures are provisional.1 36 37 31 33 11 2 6 5 4 46
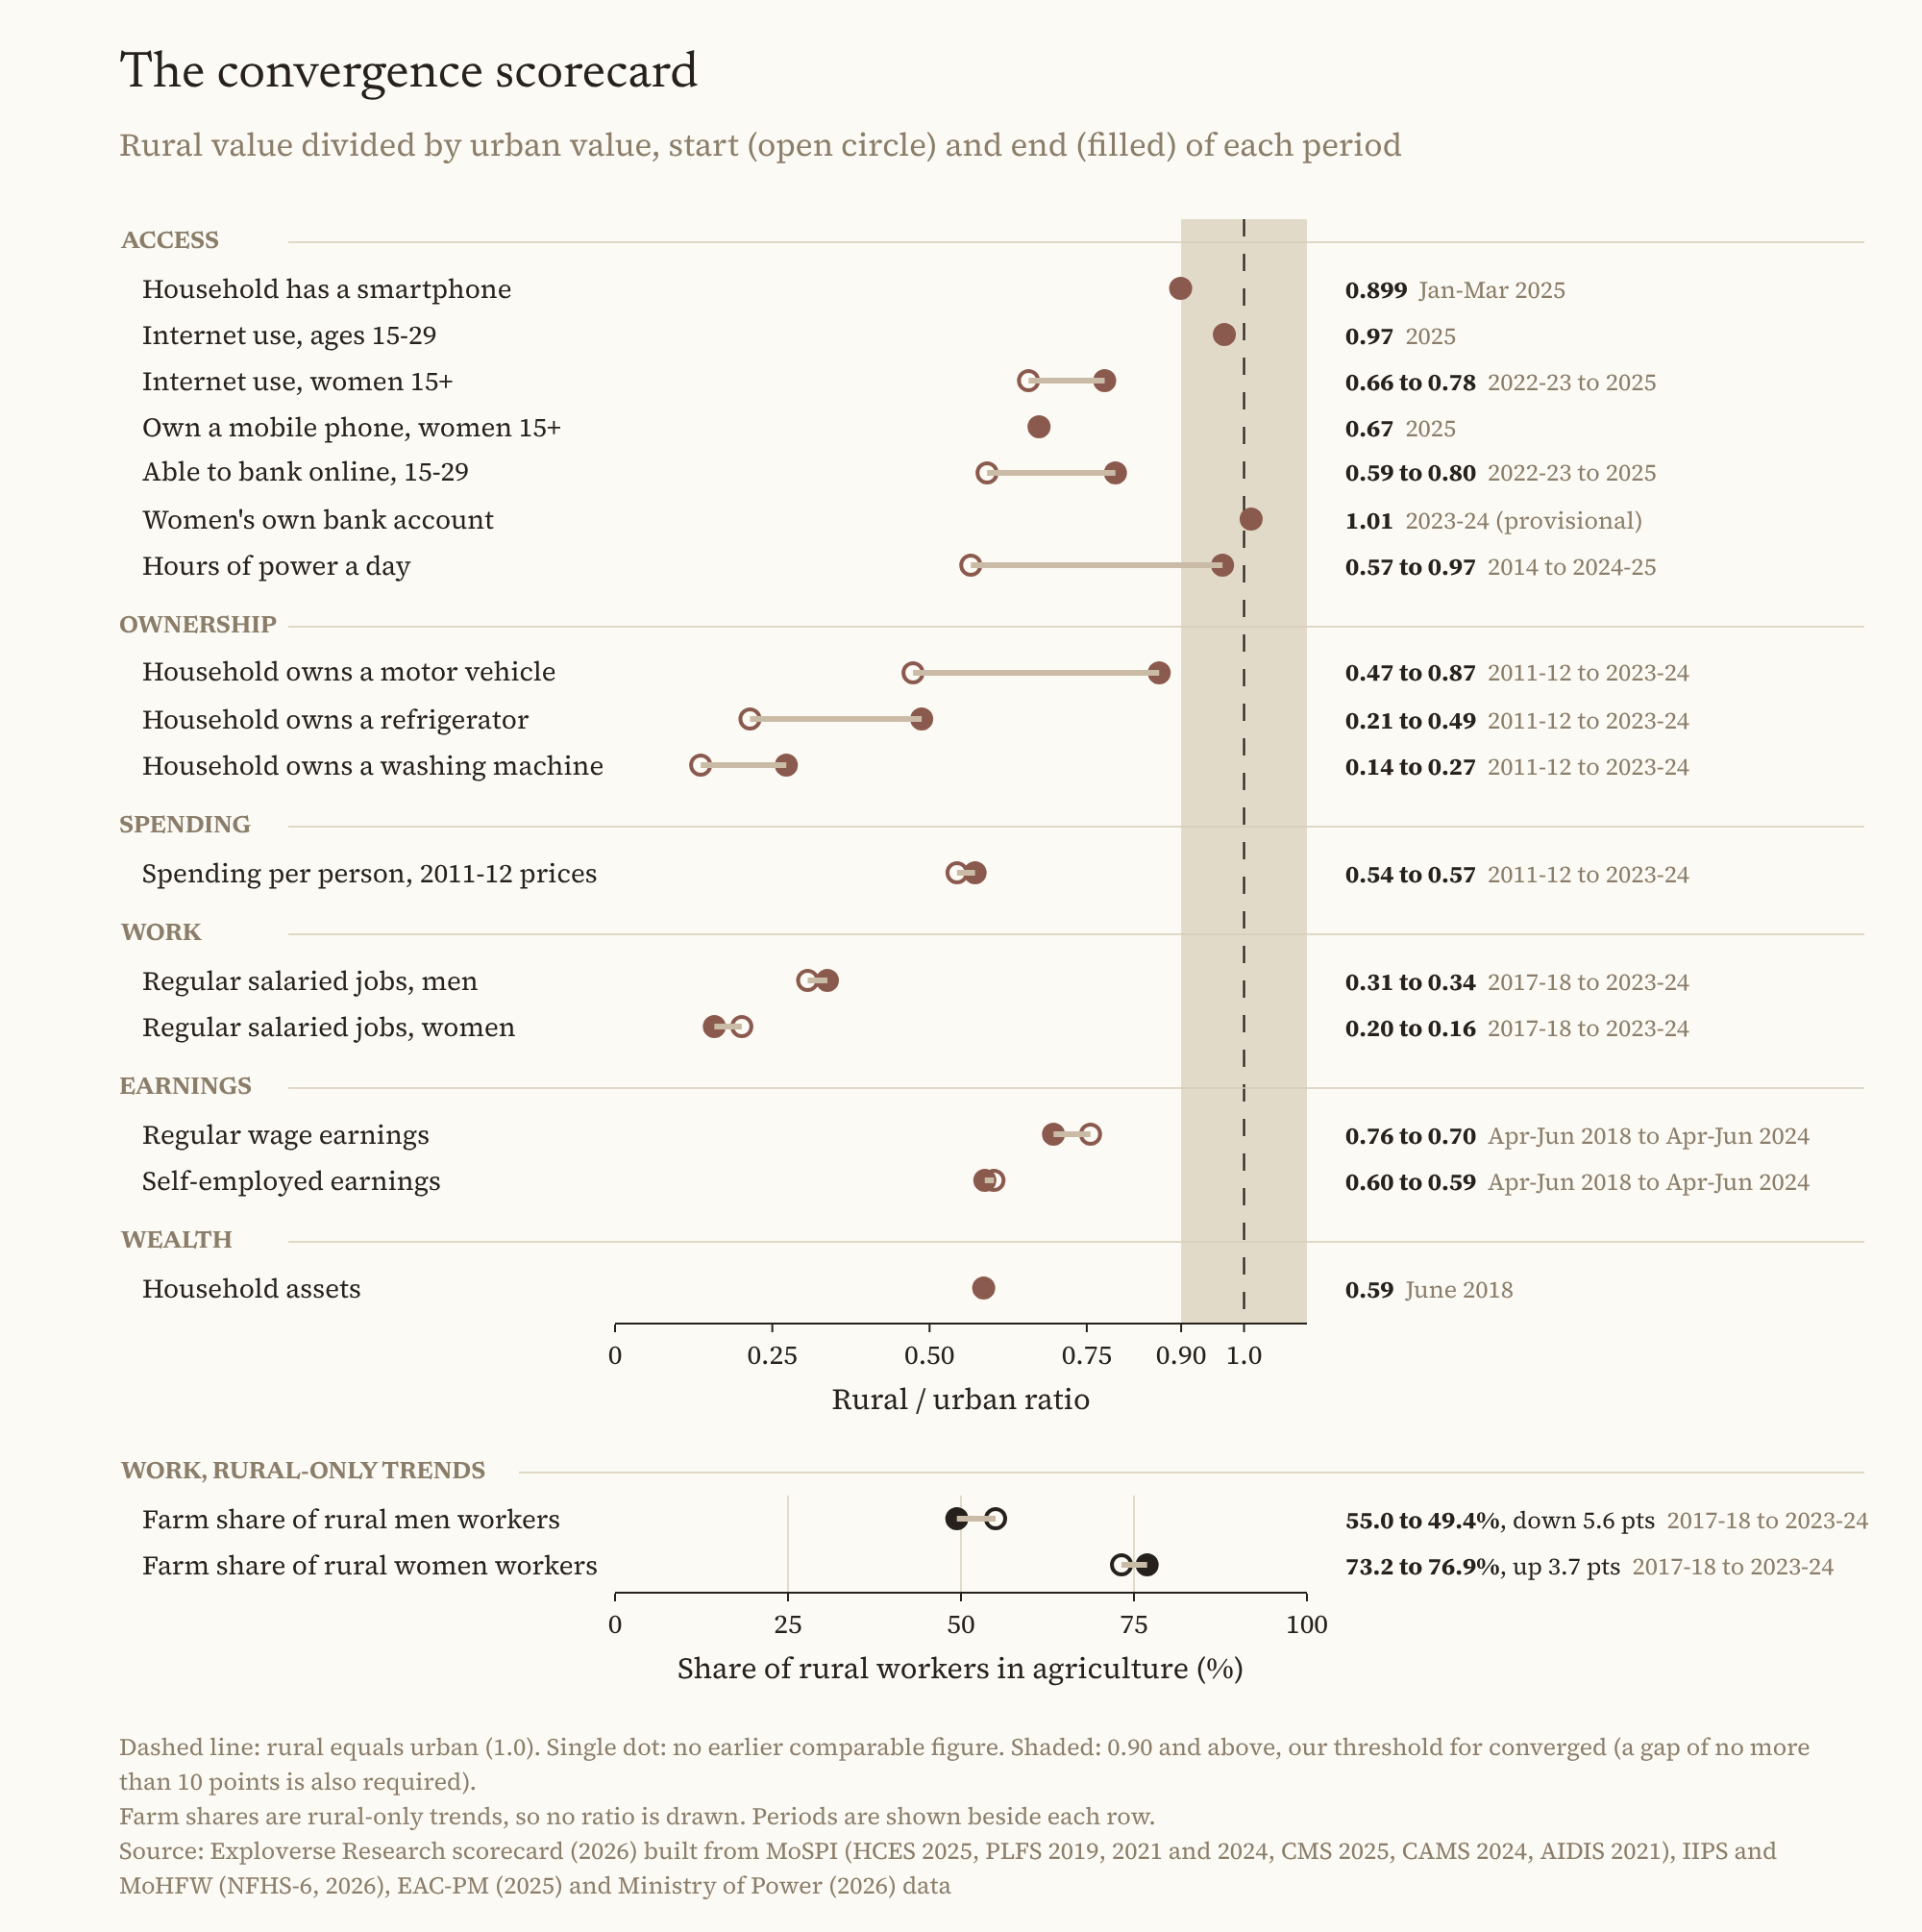
Each row shows the rural figure divided by the urban one, so 1.0 means rural equals urban. Each line runs from the earlier figure (open circle) to the latest (filled); a single dot means there is no earlier comparable figure. Most access measures sit near 1.0, though women's internet use and phone ownership and young people's online banking do not; ownership is mixed; spending moved closer in proportion but further apart in rupees; work, earnings and wealth remain far apart. The lower panel shows the share of rural men and women workers in farming, in percent. Source: Exploverse Research scorecard (2026) built from MoSPI (HCES 2025, PLFS 2019, 2021 and 2024, CMS 2025, CAMS 2024, AIDIS 2021), IIPS and MoHFW (NFHS-6, 2026), EAC-PM (2025) and Ministry of Power (2026) data.
Access is level or nearly so, except for women's phone ownership; young people's online banking is catching up from further back. Ownership is mixed: motor vehicles are catching up, refrigerators and washing machines are not. Spending is closer in proportion and further apart in rupees. Work, pay and wealth remain far apart, and regular pay has fallen further behind. The table is a selection from a longer scorecard, and some rows left out are closer, such as the food share of the budget: 47.0% in rural India against 39.7% in urban India in 2023-24.27
Other Countries
Is India unusual in converging as a consumer before it converges as a worker? Official sources allow few comparisons, and we say which could not be made.
China offers the clearest comparison of incomes. From the National Bureau of Statistics' published figures, urban per capita income was 3.33 times rural income in 2009 and 2.31 times in 2025, by our arithmetic. The 2009 figure sets urban disposable income against rural net income, while the 2025 figure uses disposable income for both, so the two ratios are not strictly comparable.66 67 Even so, at 67.89% urbanisation in 2025, urban incomes were still more than twice rural ones.67 On these figures China's gap narrowed while its farm workforce shrank, from 36.7% of workers in 2010 to 21.7% in 2025 on the World Bank's modelled estimates.68
Brazil shows the definitional point from the other end. Its Census counted 87.41% of the population as urban in 2022, using municipal laws that set urban perimeters.69 IBGE's own experimental typology, which uses density, distance and size, found that predominantly urban municipalities held 76% of the population.70 We found no official rural-urban income ratio for Brazil.
For Vietnam we could verify only the national urban share, 38.6% in 2025, and for Indonesia we could not reach the statistics office's own figure.71 On the UN's common yardstick, cities and towns held 87.6% of Vietnam's population and 86.1% of Indonesia's in 2025, against India's 84.2% and China's 83.7%.10 By that measure, all four are mostly urban, and national definitions differ more than the countries do.
The World Bank's modelled estimates show how far each country's workforce has moved off the land. In 2025, agriculture employed 41.6% of workers in India, against 27.3% in Indonesia, 25.0% in Vietnam, 21.7% in China and 7.6% in Brazil; it produced 16.2%, 13.1%, 11.6%, 6.7% and 6.1% of GDP respectively.68 India's official figures are 43.0% of workers in 2025 and 17.9% of gross value added in 2025-26, the latter by our arithmetic; the World Bank figures are shares of GDP, so the two output shares are not on the same basis.49 50 On either measure, India's workforce is the most agricultural of the five.
The general pattern rests on the World Bank's World Development Report 2008, which said that in transforming countries with rapid growth outside farming, among which it placed India and China, the movement of labour out of agriculture typically lags, "widening the rural-urban income gap".72 India's widening ratios for regular and casual pay fit that description. China's narrowing gap shows that the widening need not be permanent.
What Government and Business Can Take From This
The evidence supports some practical conclusions, and no more than these.
For government
First, the rural-urban binary is now a poor guide to what a household can reach and, for the better-off rural fifth, to what it spends; it is still a good guide to who works in farming, who earns less and who holds less wealth. Policies aimed at work and earnings still have a case for a rural focus; on access, the remaining gaps are narrower and run as much along gender as geography. Second, the statistics could test the composition question this article could not. MoSPI could publish HCES and PLFS results by village population class alongside the rural-urban split, and the Standing Committee has already recommended that MoHUA examine inter-censal surveys with the Registrar General and MoSPI.8 Third, the widening gap in wage earnings would be easier to track if the PLFS headline releases carried rural and urban earnings, and the rural wage series would regain its usefulness if the Labour Bureau published a bridge across its 2025 changes. Fourth, the largest single gap in access is women's ownership of phones and their ability to transact online, and close to half of the rise in rural women's work has been unpaid family work. The committee's call for a gender audit of the census-town test points at the same blind spot.8
For business
First, "rural" is a weak proxy for purchasing power. The better-off fifth of rural households spends like the urban middle or above, and the rural middle spends like the urban 10th to 20th percentile; state and income band will segment a market better than location. Second, reach is not the same as spending power. Phones and bank accounts now reach rural households almost as widely as urban ones, but rural pay for regular and casual work has fallen further behind urban pay since 2017-18, and self-employed earnings have not caught up. Third, household reach is not individual reach. A rural household with a smartphone may have a woman in it who does not own one. Fourth, every market figure carries someone's definition of rural, whether the Census, the RBI's 10,000, NielsenIQ's 10,000 or FADA's transport offices, and comparing them without checking is the easiest way to see convergence that is not there.
What the Line Is For
The line between rural and urban India was built to count people and to decide how places are governed. It is being kept for Census 2027 so that the next count can be compared with the last. Those are good reasons, and they are not reasons to treat it as a description of the economy.
The evidence shows a countryside whose households increasingly reach, and in part own, what urban households do. How its workers earn a living has changed more slowly, and in opposite directions for men and women, and their pay for regular and casual work has fallen further behind. The rural-urban line remains a meaningful guide to who earns less and who holds less wealth. Whether the difference between the two halves is a lag that will close, as access turns into skills and skills into jobs, or a settled divide between a national market and a rural workforce, the data cannot yet say.
A more useful question than whether rural India is still rural is which rural, measured how, for which decision. A finance ministry targeting credit, a telecom regulator counting subscribers, a company planning distribution and a statistician designing a survey each need a different answer. The binary gives all of them the same one, and Census 2027 will apply it again.
Disclosure: Exploverse Research's founder holds an executive role in an Indian agricultural machinery company and board roles in other Indian companies. This piece was produced under the house byline; no farm-equipment maker is named, and no company he is associated with was consulted for it.
Sources
- Comprehensive Modular Survey: Telecom, 2025 (press note), MoSPI/NSO via PIB, 29 May 2025.
- Household Consumption Expenditure Survey: 2023-24 (report), MoSPI, National Statistics Office, 2025.
- Household Consumption Expenditure Survey: 2023-24, press note, MoSPI, National Statistics Office, 30 January 2025.
- Annual Report, PLFS 2017-18 (July 2017 to June 2018), MoSPI, May 2019.
- Annual Report, PLFS 2023-24 (July 2023 to June 2024), MoSPI, September 2024.
- Annual Report, PLFS 2019-20 (July 2019 to June 2020), MoSPI, 2021.
- Press Note, Annual Report PLFS 2023-24, MoSPI, 22 September 2024.
- Thirteenth Report: Census Criteria for Defining Urban Areas, Standing Committee on Housing and Urban Affairs (2025-26), 18th Lok Sabha, Lok Sabha Secretariat, September 2026.
- Economic Survey 2025-26, Chapter XV, Urbanisation: Making India's Cities Work for Its Citizens, Ministry of Finance, 29 January 2026.
- World Urbanization Prospects 2025, Degree of Urbanisation, percentage of population by category, UN DESA Population Division, 2025.
- Changes in Durable Goods Ownership in India: Analysis of the Household Consumption Expenditure Survey 2011-12 and 2023-24, EAC-PM Working Paper EAC-PM/WP/40/2025, Economic Advisory Council to the Prime Minister (Shamika Ravi and Sindhuja Penumarty), November 2025.
- Census of India 2011, Rural Urban Distribution of Population (Provisional Population Totals), Office of the Registrar General and Census Commissioner, Ministry of Home Affairs, 15 July 2011.
- Population Group-wise classification of centres, Reserve Bank of India, effective 1 September 2016.
- All India Rural Financial Inclusion Survey (NAFIS) 2021-22, report, NABARD, 2024.
- Indian Telecom Services Performance Indicators, April-June 2026, TRAI, 12 October 2026.
- India FMCG Quarterly Snapshot Q2 2026 (AMJ'26), NielsenIQ, August 2026.
- FADA releases FY'26 and March'26 Vehicle Retail Data, Federation of Automobile Dealers Associations (FADA), 6 April 2026.
- India's Hidden Urbanisation & Its Policy Implications, EAC-PM Working Paper EAC-PM/WP/44/2026, Economic Advisory Council to the Prime Minister (S. Ravi, M. Joshi and A.K. Mishra), March 2026.
- Missing millions: undercounting urbanization in India, Population and Environment 41: 126-150, Onda, Sinha, Gaughan, Stevens and Kaza, 2019, DOI 10.1007/s11111-019-00329-2.
- Leveraging Urbanization in India (country brief), World Bank, 24 September 2015.
- World Urbanization Prospects 2025: Methodology of the United Nations Urbanization Estimates and Projections, UN DESA/POP/2025/DC/NO.14, UN DESA Population Division, December 2025.
- Lok Sabha Unstarred Question 3773, Census Towns, Ministry of Home Affairs, 4 September 2012.
- Unacknowledged Urbanisation: New Census Towns of India, Economic and Political Weekly 48(36): 43-51, Kanhu Charan Pradhan, 7 September 2013, open copy: MPRA.
- Census of India 2011, A-03 Appendix, Number and population of villages with population of 5000 and above and towns with population below 5000, Office of the Registrar General and Census Commissioner, 2011.
- Census of India 2011, Table A-3, Villages by population size class, Office of the Registrar General and Census Commissioner, 2011.
- Census of India 2011, Primary Census Abstract Statement 2, Percentage of villages and population by class of villages in 2001 and 2011, Office of the Registrar General and Census Commissioner, 2011.
- Household Consumption Expenditure Survey: 2023-24 Factsheet, MoSPI, National Statistics Office, 2024.
- National Family Health Survey (NFHS-5), 2019-21: India, Volume I, IIPS and ICF (hosted by The DHS Program), 2021.
- NIQ: GST 2.0 Transition Reshapes India's FMCG Growth Landscape, NielsenIQ, March 2026.
- Results of Comprehensive Modular Survey: Education, 2025 (April-June, 2025), PIB Delhi (MoSPI), 26 August 2025.
- National Family Health Survey (NFHS-6), 2023-24: Fact Sheets (India and States/UTs), International Institute for Population Sciences and Ministry of Health and Family Welfare, May 2026.
- Household Social Consumption on Education in India, NSS 75th round, Report 585 (summary), MoSPI, 2019.
- Lok Sabha Starred Question 87, Ministry of Power, 5 February 2026.
- PMGSY backgrounder, PIB, September 2025.
- Financial Inclusion in India: Banking Every Citizen (factsheet), PIB, 12 August 2026.
- Comprehensive Annual Modular Survey 2022-23 (NSS 79th round), report, MoSPI, 2024.
- Comprehensive Modular Survey: Telecom, 2025, report, MoSPI/NSO, May 2025.
- Payment System Report, December 2025, Reserve Bank of India, December 2025.
- Annual Report, PLFS 2022-23 (July 2022 to June 2023), MoSPI, 2023.
- India Jobs and Occupation Tracker 5, ICRIER, 2026.
- Annual Report, Periodic Labour Force Survey 2025 (January to December 2025), revised version, MoSPI/NSO, 29 May 2026.
- Migration in India 2020-21 (PLFS July 2020 to June 2021), MoSPI, 14 June 2022.
- NABARD press release on NAFIS 2021-22, NABARD via PIB, 10 October 2024.
- Situation Assessment Survey of Agricultural Households 2019: A Statistical Note, Review of Agrarian Studies 11(2), Aparajita Bakshi, 2021.
- NSS Report No. 533, Migration in India, July 2007 to June 2008, NSSO/MoSPI, 2010.
- Key Indicators of All India Debt and Investment Survey (NSS 77th round, 2019), press note, MoSPI, 24 August 2021.
- Table 47: Deposits and Credit of Scheduled Commercial Banks According to Population Group, Handbook of Statistics on the Indian Economy, Reserve Bank of India, 31 July 2026.
- Changing Structure of Rural Economy of India: Implications for Employment and Growth, NITI Aayog Discussion Paper, NITI Aayog (Chand, Srivastava and Singh), November 2017.
- Press Note on Periodic Labour Force Survey Annual Report 2025 (January to December 2025), MoSPI/NSO, 27 March 2026.
- Press note on new series of National Accounts (base 2022-23), MoSPI via PIB, 27 February 2026.
- Rural Roads and Local Economic Development, American Economic Review 110(3): 797-823 (accepted manuscript), Sam Asher and Paul Novosad, 2020, DOI 10.1257/aer.20180268.
- Average Daily Wage Rates in Rural India: A Brief, Labour Bureau, Ministry of Labour and Employment, undated.
- CPI for Agricultural Labourers and Rural Labourers for June 2025 (Base 2019=100), PIB release ID 2145905, Ministry of Labour and Employment, 18 July 2025.
- Downturn in Wages in Rural India, Review of Agrarian Studies 13(2), Arindam Das and Yoshifumi Usami, 2023.
- Research and Development in Farm Mechanisation for Small and Marginal Farmers in the Country, Standing Committee on Agriculture, Animal Husbandry and Food Processing, 17th Lok Sabha, 58th Report, Lok Sabha Secretariat, 21 July 2023.
- Changing Agricultural Labour Market and Its Effects on Farm Economy in India, Indian Journal of Agricultural Economics 75(4), Srivastava, Singh, Kumar, Singh and Ahmad, 2020.
- Lok Sabha Unstarred Question 1307, Ministry of Agriculture and Farmers Welfare, 11 February 2025.
- Decrease in Agricultural Holdings, PIB release PRID 1605058, Ministry of Agriculture and Farmers Welfare, 3 March 2020.
- Lok Sabha Unstarred Question 1217, Ministry of Agriculture and Farmers Welfare, 11 February 2025.
- Statistical Report on Value of Output from Agriculture and Allied Sectors 2024, NSO/MoSPI, 21 June 2024.
- Do rural roads create pathways out of poverty? Evidence from India, Journal of Development Economics 133: 375-395, Shilpa Aggarwal, 2018, DOI 10.1016/j.jdeveco.2018.01.004.
- India FMCG Quarterly Snapshot Q1 2026 (JFM'26) deck, NielsenIQ, 25 May 2026.
- Job Opportunities along the Rural-Urban Gradation and Female Labor Force Participation in India, Policy Research Working Paper 7412, World Bank (Chatterjee, Murgai and Rama), September 2015.
- Periodic Labour Force Survey (PLFS) Annual Report, 2025, PIB release PRID 2246009, MoSPI via PIB, 2026.
- National Multidimensional Poverty Index: A Progress Review 2023, NITI Aayog, July 2023.
- Statistical Communique on the 2009 National Economic and Social Development, National Bureau of Statistics of China, 26 February 2010.
- Statistical Communique on the 2025 National Economic and Social Development, National Bureau of Statistics of China, 28 February 2026.
- World Development Indicators: employment in agriculture (SL.AGR.EMPL.ZS) and agriculture value added (NV.AGR.TOTL.ZS), World Bank, updated 11 November 2026.
- Censo Demografico 2022, SIDRA Table 9923 (resident population by situacao do domicilio), IBGE, 2022 census.
- New proposal for territorial classification portrays a less urban Brazil, Agencia IBGE, 31 July 2017.
- Press release: social-economic situation in the fourth quarter and 2025, National Statistics Office of Viet Nam, January 2026.
- World Development Report 2008: Agriculture for Development, World Bank, 2007, DOI 10.1596/978-0-8213-6807-7, quotation from the Overview, p. 8.