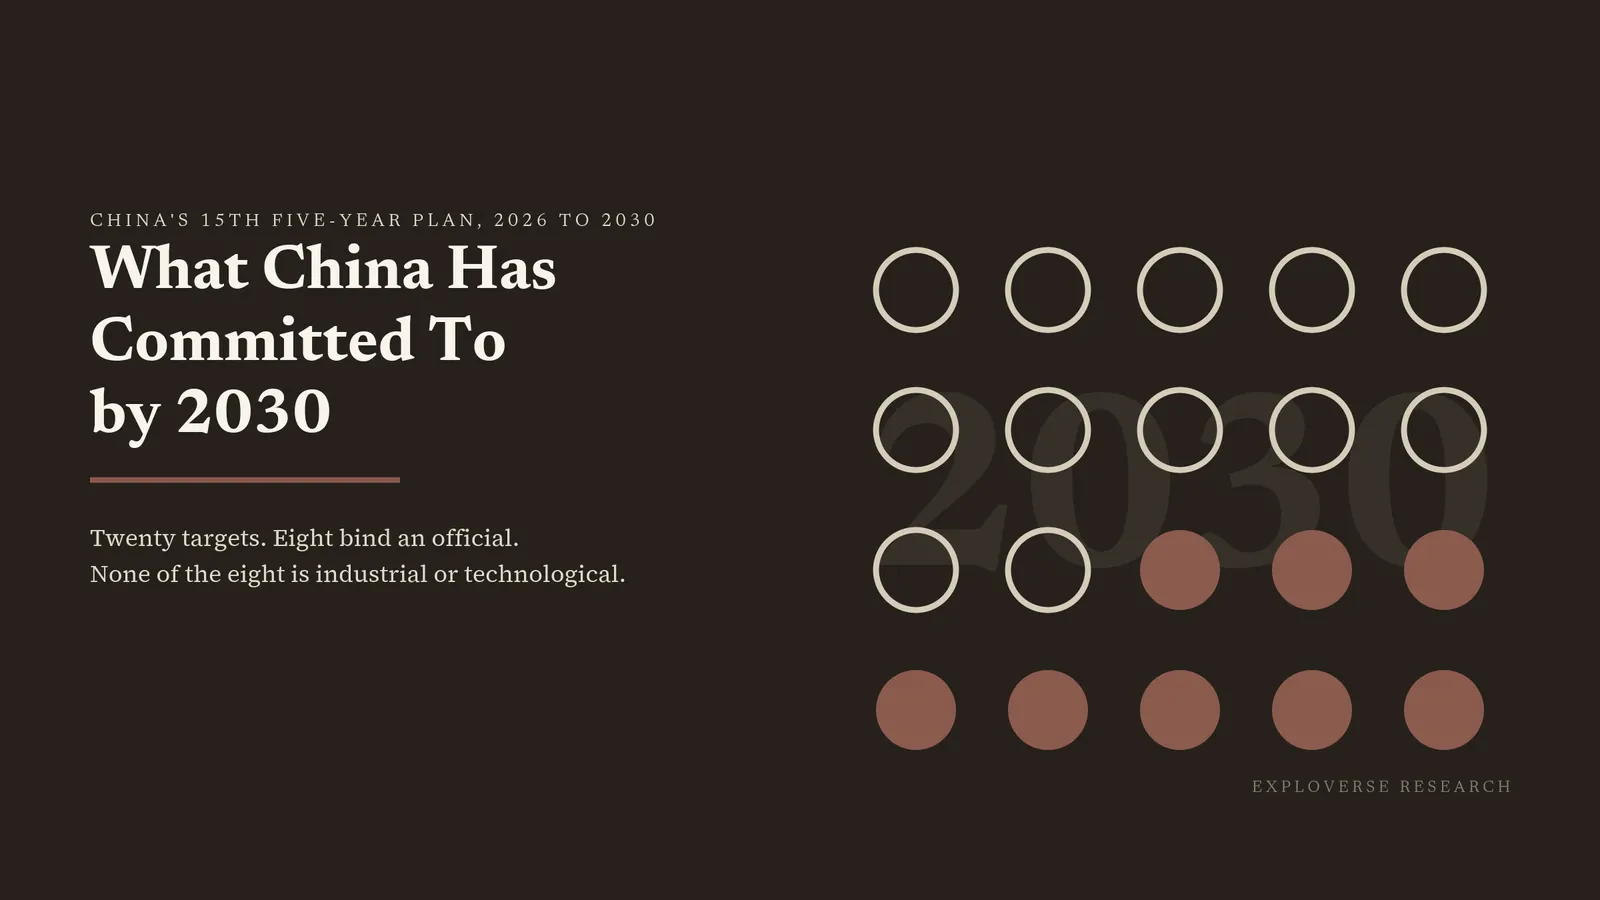
China's 15th Five-Year Plan sets twenty numbers for 2030, and only eight of them bind an official: environment, energy, food, schooling, livelihood. This is what the plan actually commits to, and where those commitments land on Indian electronics, batteries and AI infrastructure.
Exploverse Research | Deep Dive | Policy | 28 min read
Key takeaways
- China's 15th Five-Year Plan commits the state to twenty numbered indicators for 2030. Only eight bind, and all eight are environmental, energy, food, schooling or livelihood measures. Nothing industrial and nothing technological binds any official.
- There is no five-year growth number. Growth is to be kept in a reasonable range and set year by year, and the 2026 instalment is 4.5% to 5%. The long horizon carries the harder commitment: per-capita GDP at the level of a moderately developed country by 2035, double its 2020 level.
- The plan's centre of gravity is the diffusion of artificial intelligence through the economy and the cheap domestic compute to run it on, not a chip-volume target. Integrated circuits do get a programme of their own in one of the plan's boxed columns, but no self-sufficiency percentage, no capacity figure and no node target appears anywhere in the document.
- The only technology number in the indicator box measures deployment rather than capability: value added of core digital-economy industries rising from 10.5% of GDP to 12.5%. It is classified expected, not binding.
- On the things Indian industry fears most, the plan is close to silent. Rare earths get one sentence, about strengthening China's competitive advantage, and one line in a materials box. Export controls get one, a commitment to improve the system. The leverage does not live in the plan; it lives in the announcements beside it.
- For Indian firms the exposure is three different problems. In electronics it is commercial and priced. In batteries, magnets and minerals it is coercible, and dated: 10 November 2026, when China's suspension of its October 2025 export-control expansion is set to lapse. In AI it is competitive, on unequal infrastructure.
The read-through, in one paragraph
For Indian industry the plan reads differently in each of the three sectors that matter, and they are not versions of one problem. In electronics the exposure is commercial: dependence on Chinese components keeps rising, and the plan now talks about curbing ruinous domestic price competition, the one line in it that could move Chinese export pricing. In batteries and minerals it is coercible: the instrument that could restrict supply is written, has been used, and is merely suspended, with a published end date. In AI it is competitive rather than dependent, because China is planning to win on breadth of application, running on domestic compute, and that contest will arrive in third markets before it arrives here.
Twenty Numbers for 2030
The operative part of any Chinese five-year plan is a single boxed page. In the 15th Five-Year Plan it is Box 1, the main indicators for economic and social development over the plan period, on page 10 of the National Development and Reform Commission's PDF of the Outline.1 It holds twenty numbered indicators, printed as twenty-one lines because one of them splits into two, and eight of those twenty carry the marker for binding. The rest of the document is prose, plus twenty-two further boxed columns that name programmes rather than commitments; those are read later in this piece, and nothing in them enters the indicator table.1
Start with what is not there. The plan sets no five-year growth rate. The GDP row gives a 2025 baseline of 5% and then, in place of a 2030 figure, a sentence: growth is to be kept within a reasonable range and proposed year by year according to circumstances.1 The operative number is therefore annual, and for 2026 the Government Work Report set it at 4.5% to 5%.2 The commitment China is actually making about the size of its economy sits past the five-year table, at the 2035 horizon, where the plan states it plainly: by 2035, per-capita GDP at the level of a moderately developed country, double the 2020 level.3 Doubling per-capita GDP from 2020 to 2035 is roughly 4.7% a year compounded, so the annual instalments are not as loose as the empty cell makes them look. The five-year plan declines to write the number down; the fifteen-year goal implies one.
The twelve expected indicators are where the economic and technological ambitions sit, and Table 1 below carries them all. The ones that matter for this reading: whole-society R&D spending to grow by more than 7% a year at constant prices, from a 2025 outturn of 9.1%; high-value invention patents from 16 to above 22 per 10,000 people; value added of core digital-economy industries from 10.5% of GDP to 12.5%; labour productivity to grow faster than GDP; urbanisation from 67.9% to 71%. The rest are livelihood measures, from physicians and nurses per 1,000 to life expectancy at 80 years.1
Then the eight that bind. Average years of schooling of the working-age population, 11.3 to 11.7. CO2 per unit of GDP, down a cumulative 17%. Non-fossil energy as a share of total energy consumption, 21.7% to 25%. PM2.5 in prefecture-level and larger cities, 28 micrograms per cubic metre falling below 27. Good-quality surface water, 80% to 85%. Forest cover, 25.1% to 25.8%. Grain production capacity, 1.39 to about 1.45 trillion jin. Energy production capacity, 5.13 to 5.8 billion tonnes of coal equivalent.1 Xinhua's explainer of the draft states the split without ornament: eight binding, twelve expected, and all five green and low-carbon indicators among the binding.4
Read that list again for what is missing. Schooling, carbon, energy mix, air, water, forest, grain, energy supply. Every binding commitment in this plan is environmental, energy, food, education or livelihood. Not one is industrial, not one technological. The state binds itself to the cost side of development and leaves the competitive side to the expected column, where the R&D growth rate, the patent count and the digital-economy share sit. That is the most useful fact in the document for a reader outside China: it says which ambitions come with a named official carrying a number and which come with encouragement.
The distances vary enormously, and the chart sets them side by side as percentage moves from the 2025 baseline. The two energy-supply commitments are the largest jumps among the binding indicators that state both a 2025 level and a 2030 level: 15% more non-fossil share and 13% more energy production capacity in five years. The binding carbon-intensity commitment is larger still at a 17% cumulative cut, but it is a rate rather than a level and so does not appear in the chart. Forest cover moves 2.8% and life expectancy 0.95%, which is what a saturated indicator looks like. The largest expected gap is high-value patents, up 37.5% on a base that has more than doubled in five years.
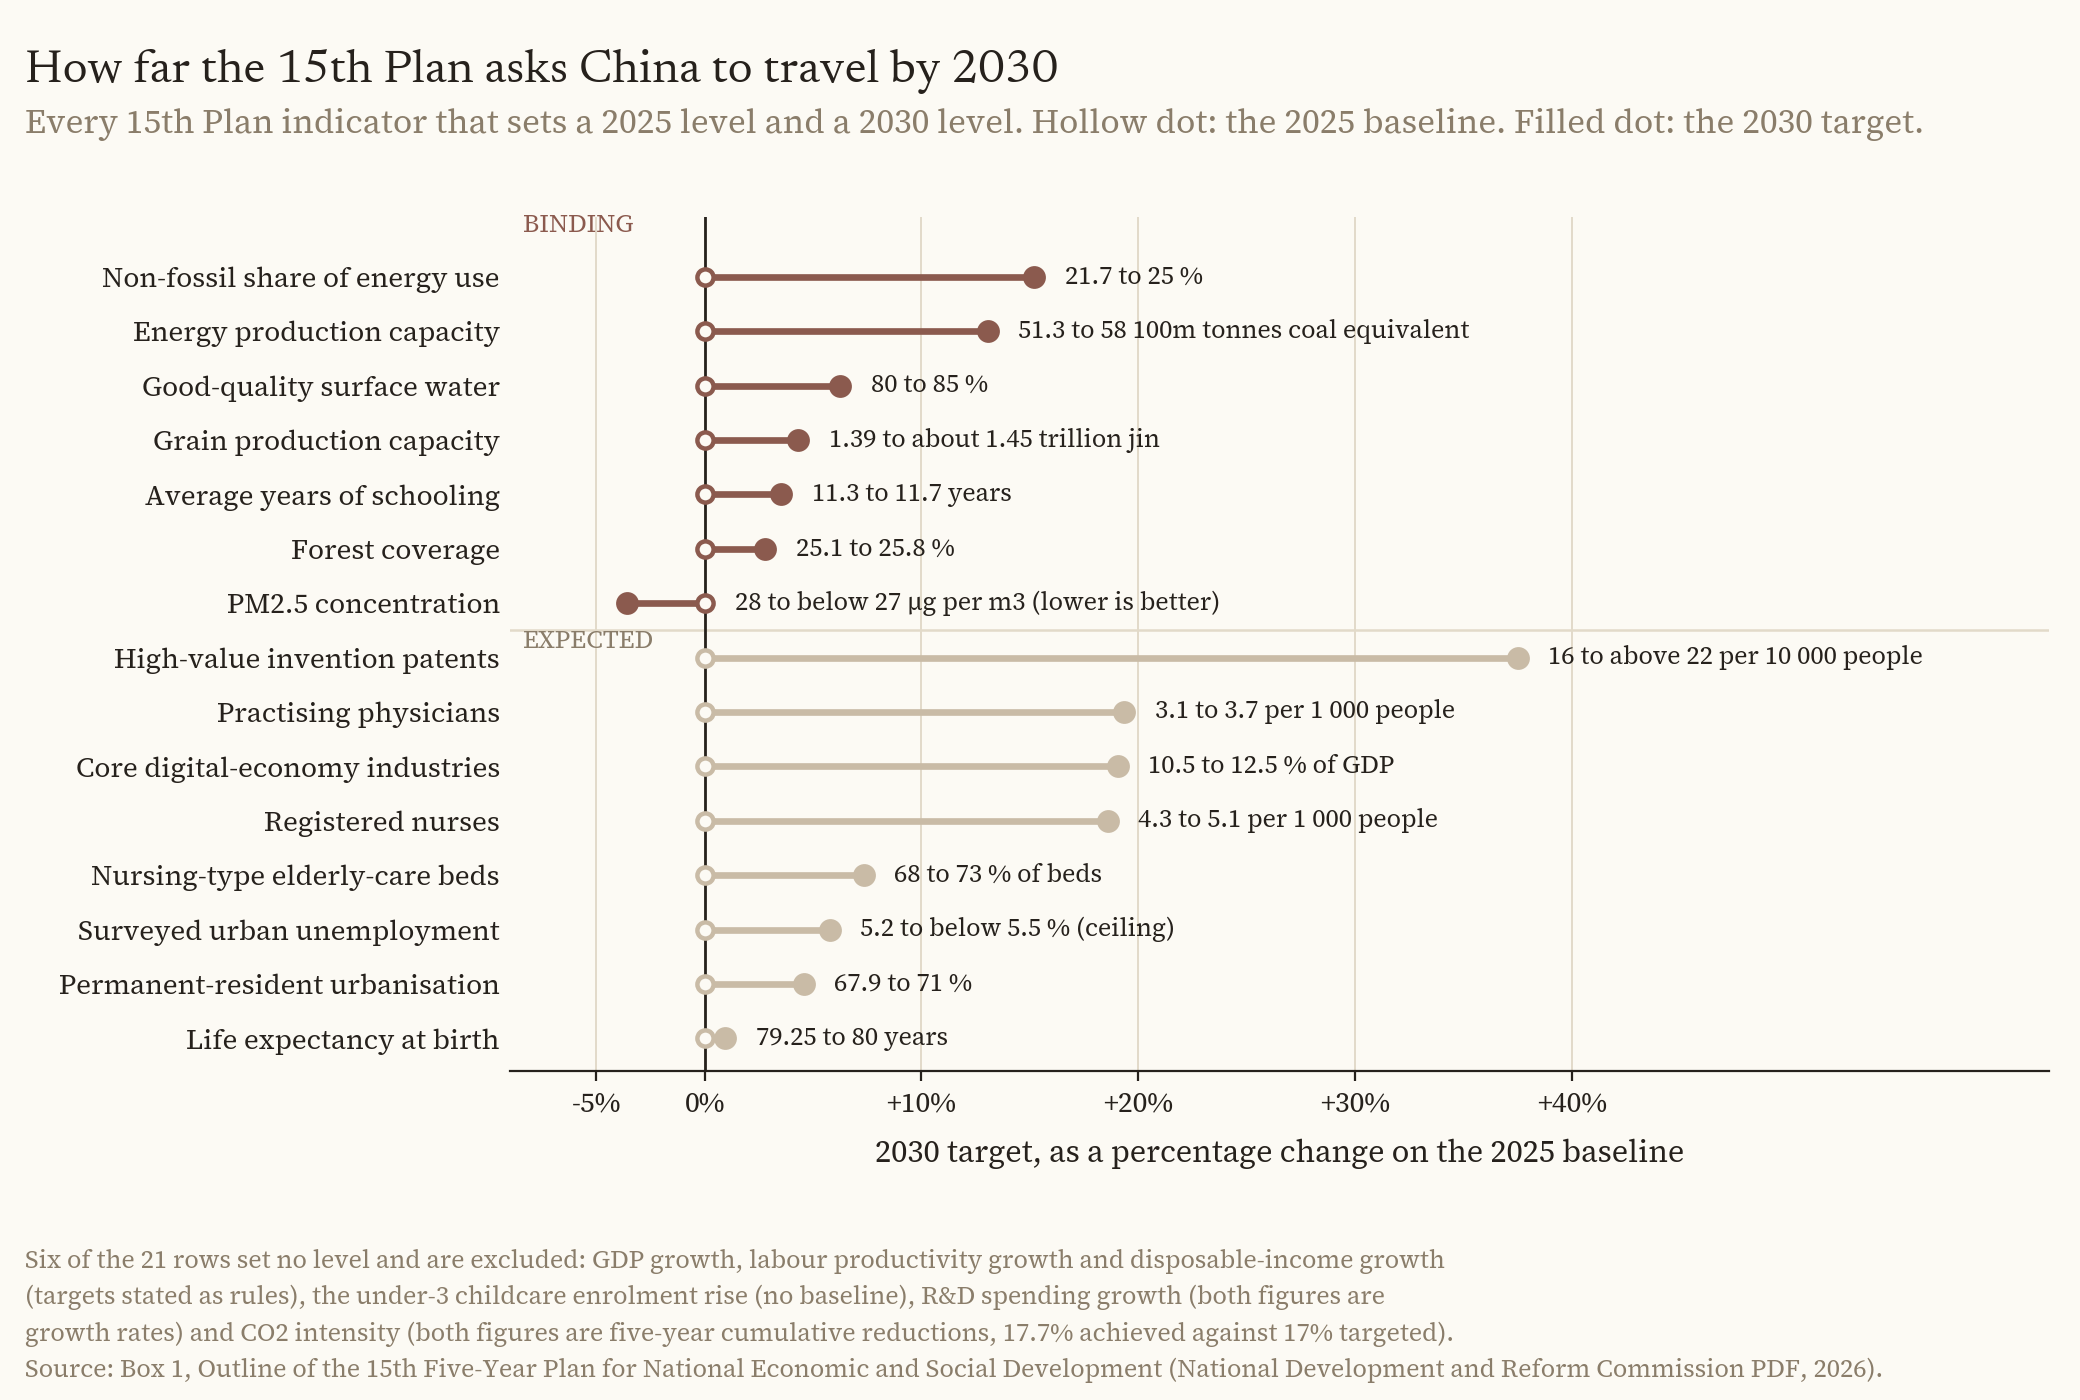
Chart 1. Each 15th Plan indicator that carries both a 2025 baseline and a 2030 value, shown as the distance between them and coloured by whether the indicator is binding or expected. Six of the twenty-one rows set no level and are omitted: GDP growth, labour productivity growth and disposable-income growth, whose targets are stated as rules; the under-3 childcare enrolment rise, which has no baseline; R&D spending growth, where both figures are growth rates; and CO2 intensity, where both figures are five-year cumulative reductions. The binding set is entirely environmental, energy, food and education. Source: Box 1, Outline of the 15th Five-Year Plan for National Economic and Social Development, National Development and Reform Commission PDF of the adopted text, March 2026.
Three figures circulate in secondary readings that the primary table does not carry: a 10.2% digital-economy baseline, 78.6 years of life expectancy and a 20.8% non-fossil baseline. Box 1 gives 10.5%, 79.25 and 21.7%.1 A count of twenty-one indicators also circulates; that is the number of printed lines. Xinhua's explainer of the draft and the Fujian provincial development and reform commission both state twenty.4 5
| # | Indicator | 2025 baseline | 2030 target | Status | In the 14th Plan |
|---|---|---|---|---|---|
| 1 | GDP growth | 5% | reasonable range, set annually | Expected | Same, same formulation |
| 2 | All-labour productivity growth | 6.1% | above GDP growth | Expected | Same |
| 3 | Urbanisation rate | 67.9% | 71% | Expected | Same, target 65% |
| 4 | Growth in R&D spending | 9.1% | above 7% a year | Expected | Same, with an added R&D-intensity clause now dropped |
| 5 | High-value invention patents per 10,000 | 16 | above 22 | Expected | Same, target 12 |
| 6 | Core digital-economy industries, share of GDP | 10.5% | 12.5% | Expected | Same, 7.8% to 10% |
| 7 | Surveyed urban unemployment | 5.2% | below 5.5% | Expected | Same |
| 8 | Growth in disposable income | 5% | in step with GDP | Expected | Same |
| 9 | Average years of schooling, working age | 11.3 | 11.7 | Binding | Same, binding, 10.8 to 11.3 |
| 10 | Physicians and nurses per 1,000 | 3.1 / 4.3 | 3.7 / 5.1 | Expected | Physicians only, one line |
| 11 | Nursing-type beds in elderly care | 68% | 73% | Expected | Not in the box |
| 12 | Rise in under-3 childcare enrolment | n/a | +6 points | Expected | Measured as places per 1,000, not enrolment |
| 13 | Life expectancy | 79.25 | 80 | Expected | Same, expressed as a one-year rise |
| 14 | CO2 per unit of GDP | 17.7% cut achieved | 17% cumulative cut | Binding | Same, binding, 18% cut |
| 15 | Non-fossil share of energy consumption | 21.7% | 25% | Binding | Not in the box |
| 16 | PM2.5 concentration | 28 µg/m3 | below 27 | Binding | Measured as good-air days, binding |
| 17 | Good-quality surface water | 80% | 85% | Binding | Changed: renamed from Grade-III-or-better water bodies and rebased, 83.4% to 85% |
| 18 | Forest cover | 25.1% | 25.8% | Binding | Same, binding |
| 19 | Grain production capacity | 1.39 trillion jin | about 1.45 | Binding | Same, binding, in tonnes |
| 20 | Energy production capacity | 5.13bn tce | 5.8bn tce | Binding | Same, binding |
| Dropped from the 14th Plan's box | Energy consumption per unit of GDP, binding; basic pension coverage rate, expected |
Table 1. Source: Box 1 of the adopted 15th Five-Year Plan Outline, with the 14th Plan's box as the reference column.1 6 The 2025 baselines for indicators 6 and 18 are marked in the table as 2024 figures. The indicator datasets behind this table ship with this article.
What Moved in the Box
The 2030 box keeps most of what the 2025 box had: twenty indicators, eight of them binding, in the same five categories of economic development, innovation, livelihood, green and low-carbon, and security of supply.1 6 Four rows changed, two are new and two are gone, and the changes carry meaning. The binding energy-intensity target, a 13.5% cumulative cut in energy per unit of GDP, has no successor; carbon intensity does the work instead, and a binding non-fossil share is added beside it, which Xinhua's explainer describes as a clear orientation toward low-carbon energy transition.6 4 The difference is not cosmetic: an energy-intensity target penalises using more electricity, awkward for a country building compute clusters, while a non-fossil target penalises using the wrong electricity. The binding good-air-days indicator becomes a PM2.5 limit, harder to hit by counting favourable weather. The binding water row was renamed and rebased: the last plan measured surface water at Grade III or better from 83.4%, this one measures good-quality water bodies from 80%, so the shared 85% endpoint is reached from a lower and differently defined base.1 6 The R&D row keeps its formula, above 7% a year, but loses the accompanying clause striving for R&D intensity above the previous period's outturn, so the surviving commitment is to spend more rather than to spend more relative to output.6 The digital-economy share carries a fresh baseline, 10.5% against 7.8%.6 And security of supply, which holds grain and energy production capacity and nothing else, is carried over intact. When Chinese planning made security of supply a standing category, what it chose to measure was food and energy, and it has not added anything industrial to it.
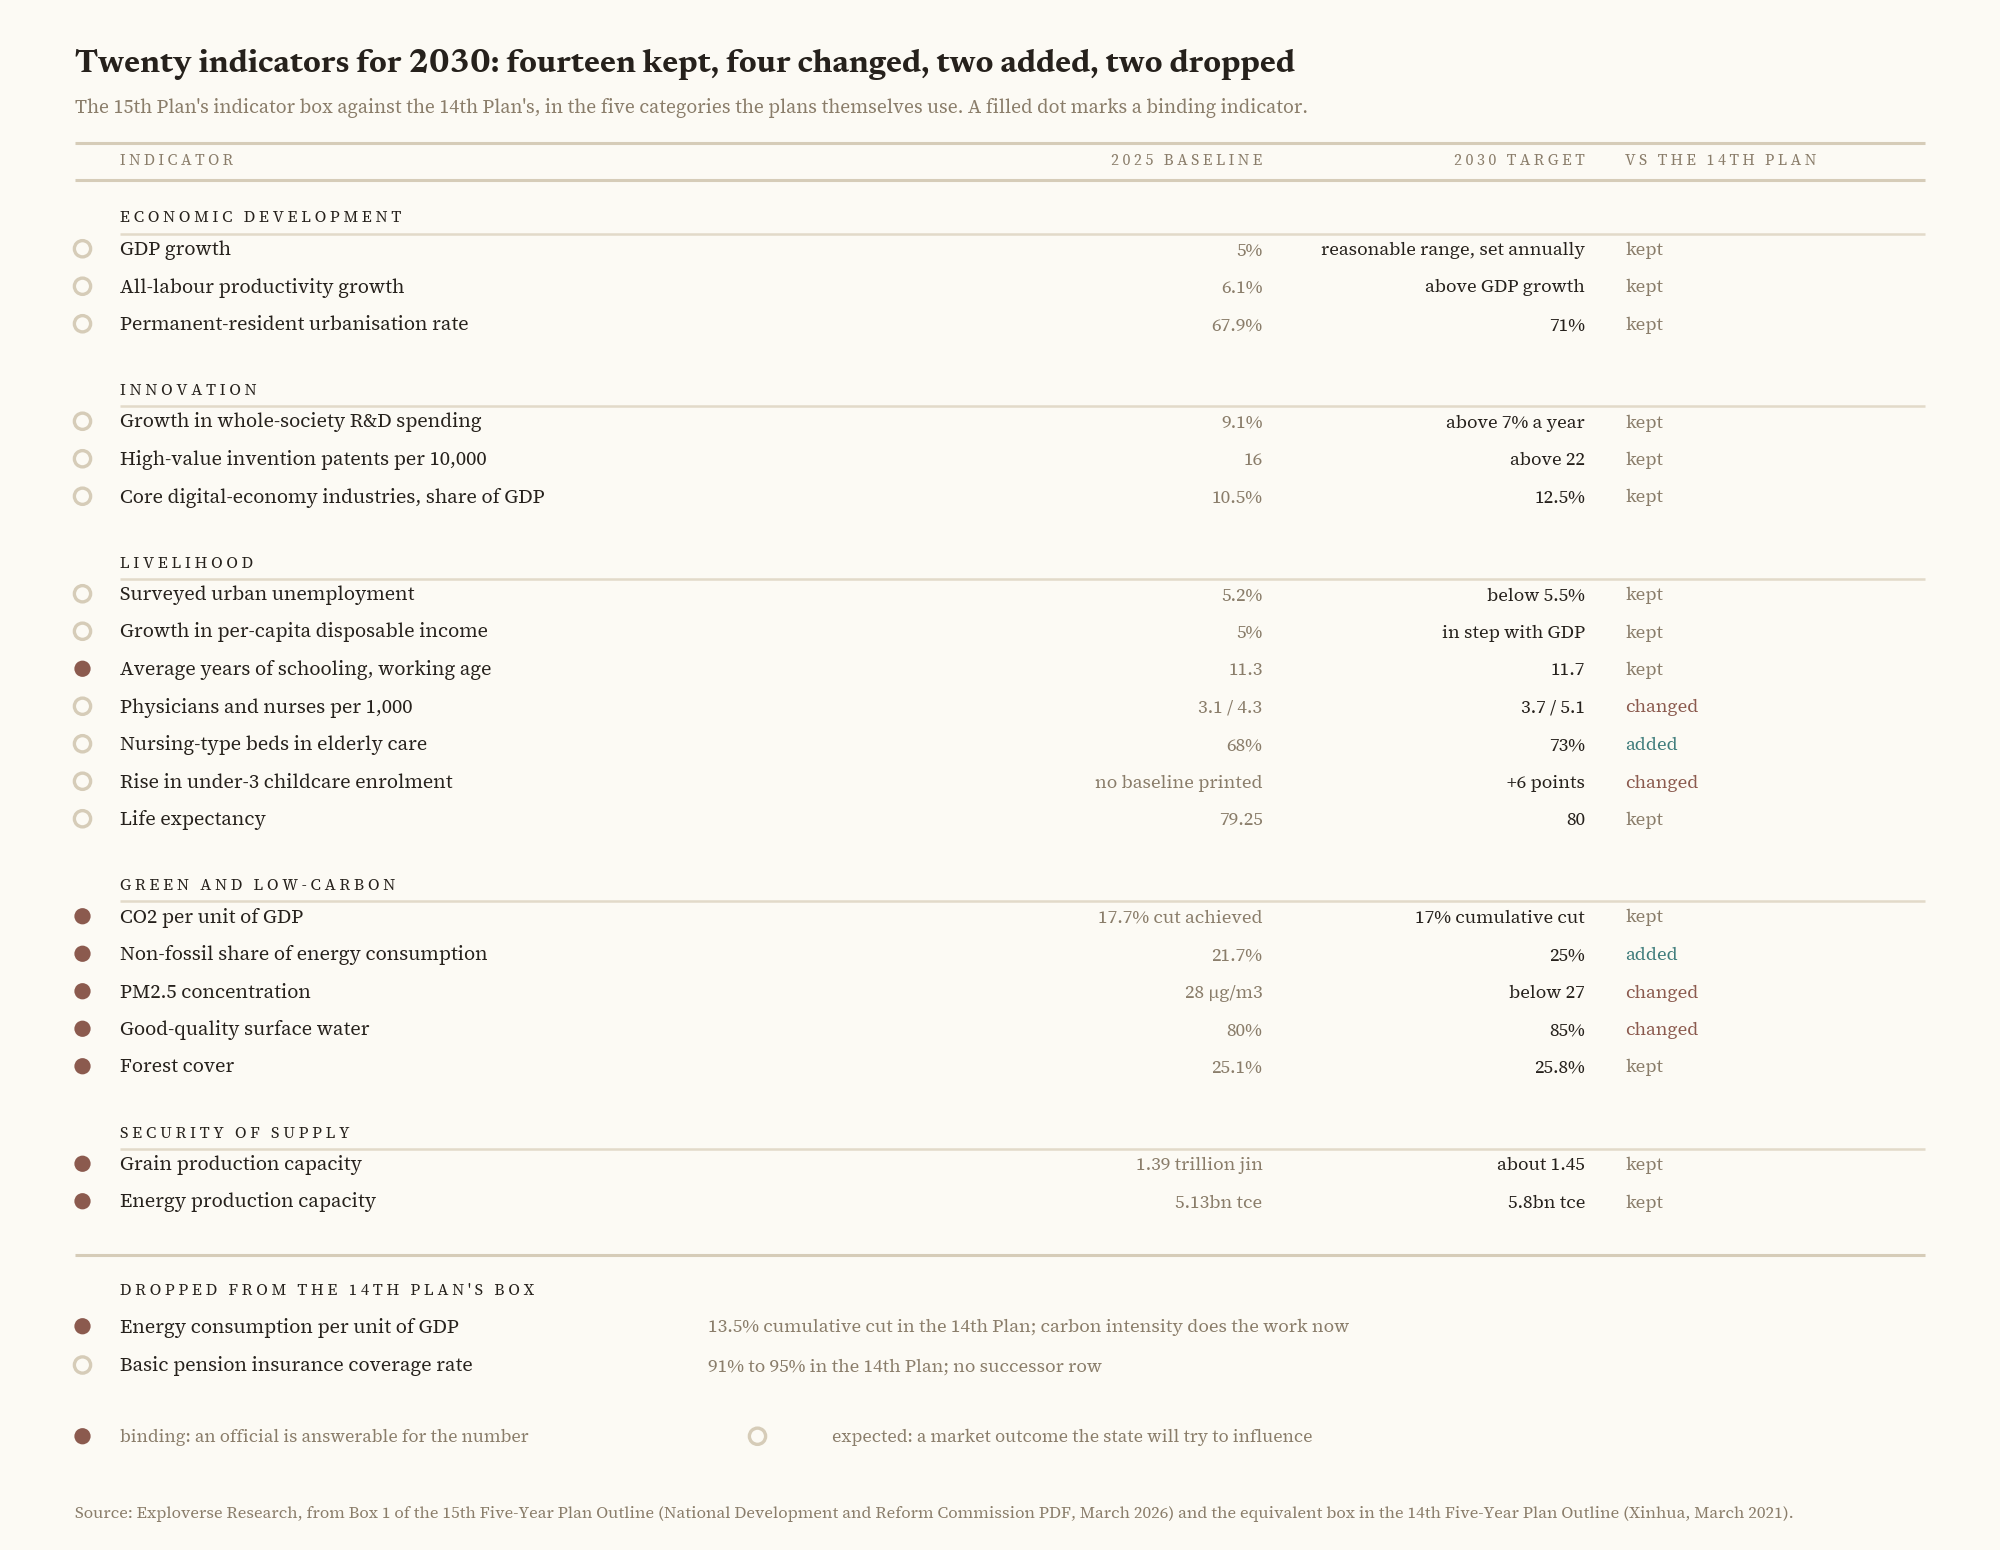
Chart 2. Every indicator in the 15th Plan's Box 1 set against the 14th Plan's, labelled kept, changed, added and dropped, with binding indicators flagged. Fourteen kept: growth, productivity, urbanisation, R&D spending growth, high-value patents, digital-economy share, unemployment, disposable income, schooling, life expectancy, carbon intensity, forest cover, grain capacity, energy capacity. Four changed: physicians becomes physicians and nurses; childcare places becomes childcare enrolment; good-air days becomes PM2.5 concentration; Grade-III-or-better surface water becomes good-quality water bodies, rebased from 83.4% to 80%. Two added: nursing-type elderly-care beds; the non-fossil energy share. Two dropped: energy intensity; basic pension coverage. Source: Exploverse Research, from Box 1 of the 15th Five-Year Plan Outline (National Development and Reform Commission PDF, March 2026) and the equivalent box in the 14th Five-Year Plan Outline (Xinhua, March 2021).
How the Plan Works
A five-year plan is not a forecast and it is not a budget. It is the document that sets what the Chinese state will hold itself to for five years, and it is made in two stages that get confused with each other. First the Communist Party's Central Committee adopts a set of Recommendations, which happened on 23 October 2025 at the fourth plenary session of the 20th Central Committee, with Xi Jinping heading the drafting group.7 The Recommendations name directions and carry almost no numbers.8 The State Council then turns them into the Outline, the operational document holding the indicator box, the chapter structure and the boxed programme columns, and it goes to the National People's Congress, which approved this one on 12 March 2026.9 What the two classes mean is set out in the plan's implementation chapter, Chapter 62: both are broken down into the annual plan's indicator system, but binding indicators, with public-service, environmental and security tasks, have responsibility formally assigned, while expected indicators, with industrial and structural tasks, are pursued by creating a favourable policy, institutional and legal environment.3 Binding means someone is answerable for the number. Expected means the state will try to influence a market outcome and will not be held to it. What the chapter does not say is what follows a miss: it assigns responsibility and requires evaluation but attaches no sanction, so binding here is an accountability rule, not a penalty.3 Both routes end in evaluation: the mid-term evaluation is reported to the Standing Committee of the National People's Congress, and the final summary evaluation is submitted to the Congress itself.3 This piece takes no view on how India should organise its own planning; the instrument is described because reading the document requires knowing what the last column means.
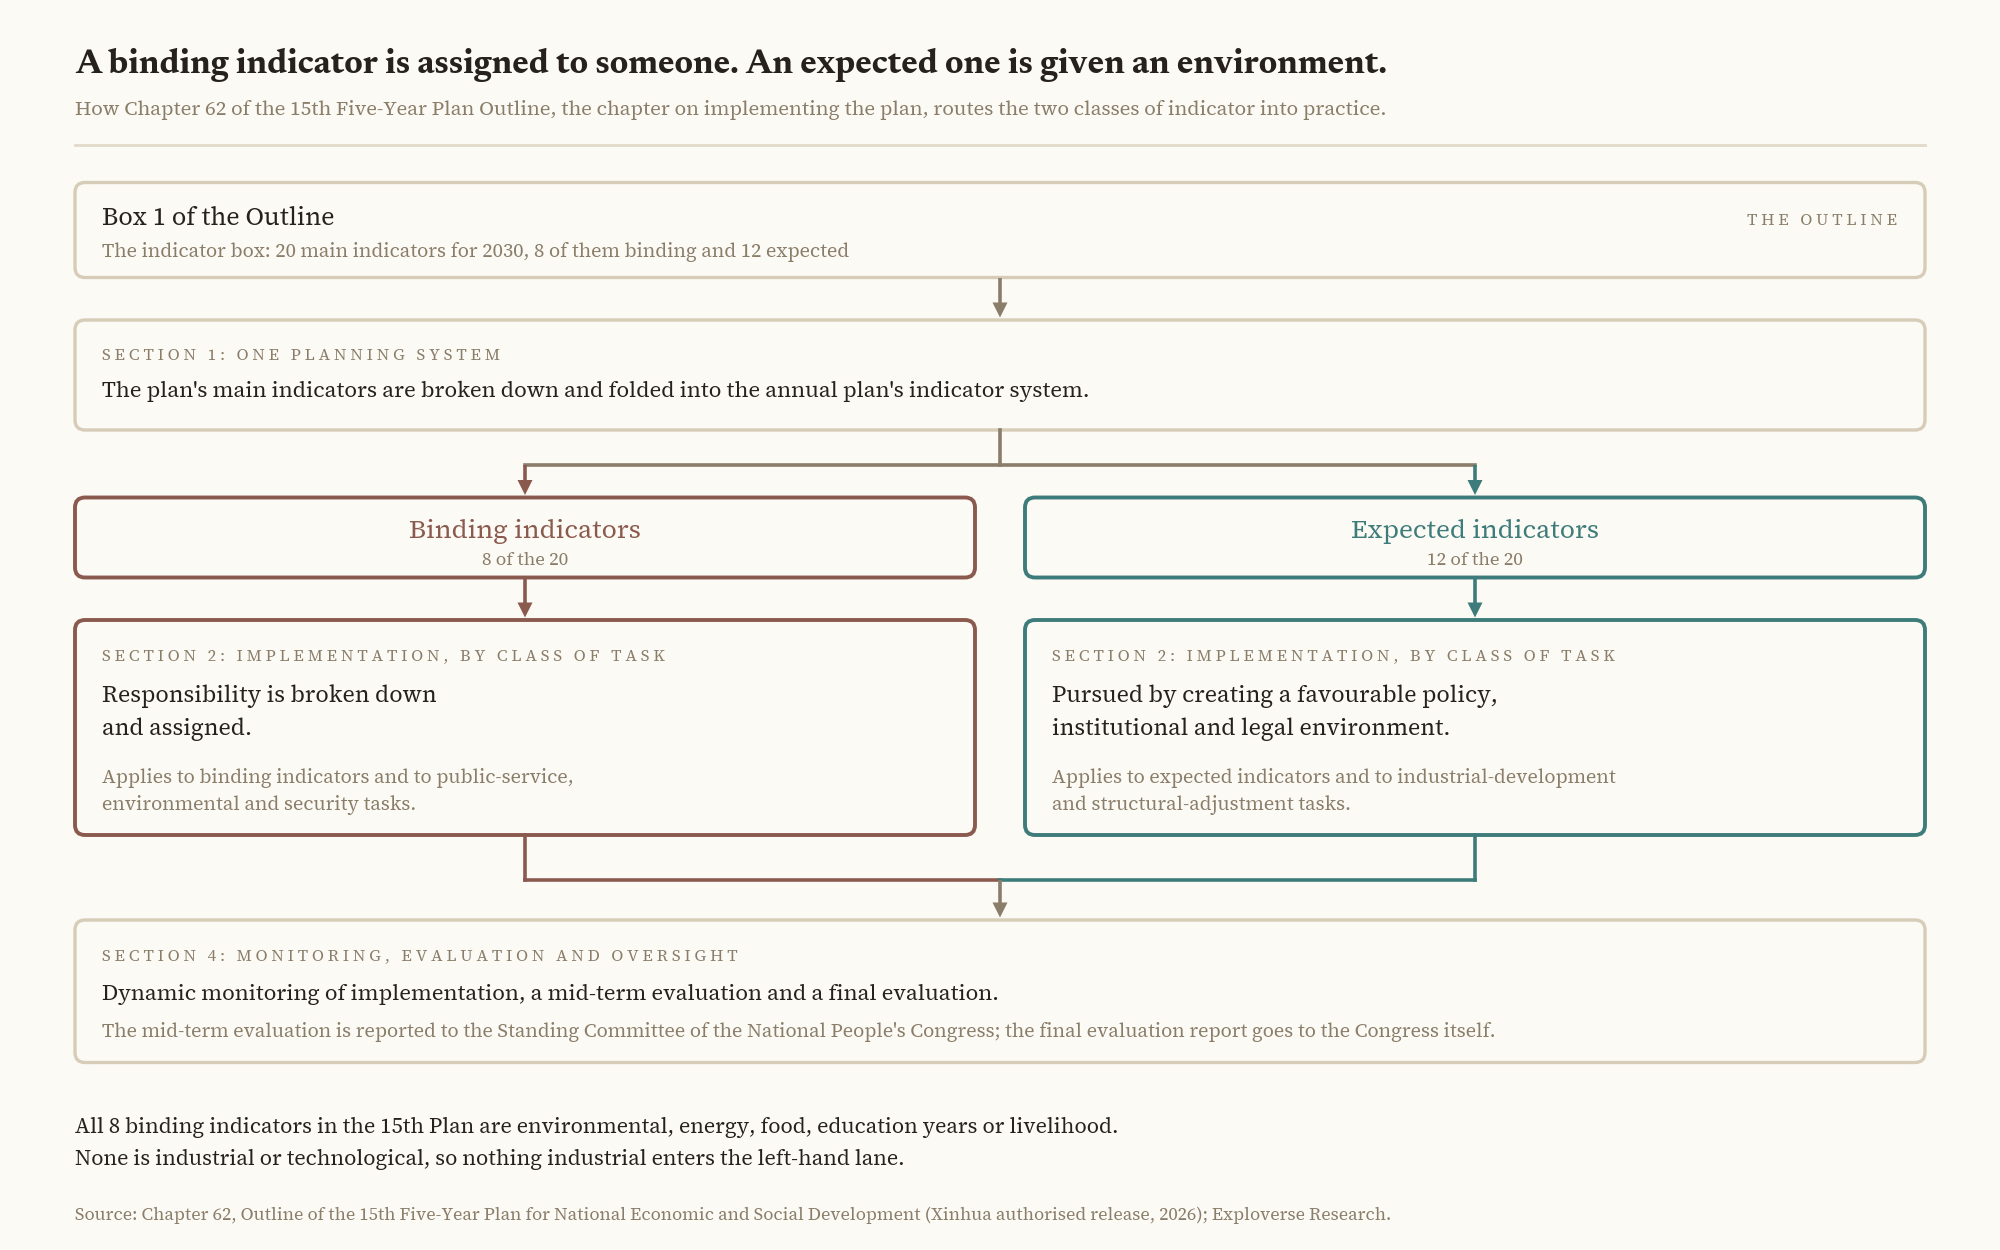
Chart 3. Chapter 62 of the 15th Plan Outline, the implementation chapter, routes the two classes of indicator differently. Both are broken down into the annual plan's indicator system, but binding indicators, with public-service, environmental and security tasks, have responsibility broken down and assigned; expected indicators, with industrial and structural tasks, are pursued by creating a favourable policy, institutional and legal environment. Both routes end in evaluation: the mid-term evaluation goes to the Standing Committee of the National People's Congress and the final summary evaluation to the Congress itself. All eight binding indicators in the 15th Plan are environmental, energy, food, education years or livelihood, so nothing industrial or technological enters the left-hand lane. Source: Chapter 62, Outline of the 15th Five-Year Plan for National Economic and Social Development, Xinhua authorised release, March 2026; Exploverse Research.
What the Plan Is About
The obvious objection to reading a plan through its indicator box is that Chinese industrial policy runs through guidance funds, provincial catalogues and the fiscal system, none of which appear in the Outline. That is correct, and it is why the rest of this piece reads the prose and the boxed columns rather than the table.
The Outline runs to eighteen parts. Where they sit, and how much text each gets, is the closest thing the document has to a statement of priority, and the ordering is not what a reader of the last plan would expect.
What the boxed columns name
Twenty-three boxed columns sit inside the Outline. Box 1 is the indicator table; the other twenty-two are programme lists, and they are where the industrial detail lives. A reader who stops at the prose will conclude the plan is vaguer than it is.1
Box 3, on cultivating new industries and new tracks, runs to ten numbered items and the first is integrated circuits. It commits China to perfecting and refining mature process nodes, to raising advanced-node manufacturing capability, to accelerating key equipment, materials and components, to developing high-performance processors and high-density memory, to upgrading wide-bandgap semiconductors and industrialising ultra-wide-bandgap materials including gallium oxide and diamond, and to breakthroughs in compute-in-memory, three-dimensional integration and optoelectronic fusion. Item 4 is new-type batteries, and it is as specific: high-capacity electrode materials, high-conductivity electrolytes, composite current collectors, high-precision coating and high-speed stacking equipment, and high-safety, high-energy-density cells for smart terminals, storage and electric transport. The other eight items are embodied intelligence, biomanufacturing, commercial space, the domestic large aircraft programme (C919 capacity and supply chain, C929 technology and its engine), low-altitude equipment, green hydrogen, brain-computer interfaces and medical devices.1
Three other boxes matter for the same reading. Box 2 names the layer underneath: rare-earth functional materials, superhard materials, precision bearings, high-performance motors, connectors and sensors, domestic operating systems and industrial software, machine tools and instruments. Box 8, on frontier research, opens with artificial intelligence, and its first line is high-performance AI chips and a usable base software stack, with quantum computing and controlled fusion behind it. Box 7 carries the compute build: a nationally integrated computing network with a scheduling platform, satellite internet, ten-gigabit optical networks and half a million 5G-Advanced base stations.1
That is the sharper version of this article's argument, not a qualification of it. The programmes are named, down to gallium oxide and stacking equipment. The boxes carry occasional numbers of their own, almost all in energy, transport and environment, but not one of the twenty-two programme boxes reaches the indicator table, and Chapter 62's responsibility rule reaches only the eight indicators Box 1 marks binding. China has written down what it intends to build and attached the accountability to forest cover.
Artificial intelligence and computing power
The plan gives digital development a whole part of its own, the fourth, and splits it into three chapters: the efficient supply of computing power, algorithms and data; comprehensive empowerment by digital-intelligent technology; and a healthy, orderly development ecosystem.3 The framing chapter commits to deepening and extending "AI Plus" to empower economic and social development; the application chapter commits to fully implementing it, seizing the commanding heights of AI industrial application and empowering, in the plan's own phrase, a thousand industries and a hundred trades.3 The compute chapter is unusually concrete for a document at this altitude. It commits to accelerating national hub computing clusters and studying ultra-large intelligent ones, to market-based construction and operation of compute facilities including government purchase and leasing of compute, to co-locating green power with compute, to national monitoring and scheduling, to an autonomous and controllable hardware and software ecosystem, and to lowering the cost of compute for smaller firms. The algorithm section adds breakthroughs in AI foundational theory and co-ordinated innovation across model, chip, cloud and application.3 One comparison puts the scale of the shift in perspective: in the body prose of this plan the term for computing power appears twenty times, against once in the 14th Plan and never in the 13th.10 11 Artificial intelligence appears thirty times in the same body prose, against six and one.10 Every occurrence count and per-10,000-character figure in this section is a literal string count over the body prose of the three Outlines as published on the web, which excludes the boxed columns in all three because they are printed as images on the source pages. The comparison is like for like, and it understates the 15th Plan, whose boxes carry more of these terms than its prose does.10
High-level science and technology self-reliance
Part three carries the innovation programme, and it is written as capability rather than as product. The plan commits to systematic deployment at the world's scientific frontier, with strategic deployments in artificial intelligence, quantum technology, biotechnology and new energy, to a national list of key and emerging technologies, and to major national science and technology projects oriented toward 2035, deployed ahead of schedule.3 Its chapter on original innovation commits to strategically contested fields and weak links in industrial and supply chains, extraordinary measures, and whole-chain breakthroughs in key core technologies in integrated circuits, industrial machine tools, high-end instruments, basic software, advanced materials and biomanufacturing.3 Integrated circuits are named first in that list, and again in the education chapter, which commits to expanding degree provision in artificial intelligence and integrated circuits beyond normal procedure.3 What the plan does not do, in the chapter or in the boxes, is say how much of anything it intends to make. There is no self-sufficiency percentage, no wafer capacity figure and no node target anywhere in the document.
The modern industrial system
Part two opens on a phrase worth reading closely: keep the manufacturing share reasonable, and build a modern industrial system with advanced manufacturing as its backbone.3 Reasonable is a permissive word, the kind a drafter reaches for when the share is likely to fall. Three commitments in that part matter commercially. The first is the campaign against what the plan calls involutionary competition, the ruinous price war in Chinese industry: capacity monitoring and early warning, planning guidance, capacity regulation, price governance and industry self-discipline to rectify it, plus orderly exit of inefficient capacity and a reasonable reduction in manufacturing's costs.3 The phrase appears once in the whole document, boxes included, and should not be inflated into a programme, but it is written down.1 The second is insurance rather than expansion: risk assessment and response mechanisms for industrial and supply chain security, strategic hinterland construction and backup capacity for key industries, and materials reserve bases.3 That is the vocabulary of redundancy against disruption, not of chain growth. The third is the shift in industrial policy design, toward what the plan calls universal and functional industrial policy, with disclosure, evaluation and exit mechanisms.3 Set against the last plan the emphasis has thinned: industrial and supply chains run at 2.99 per 10,000 characters here against 6.01, and manufacturing at 2.24 against 5.33.10
Consumption and the unified national market
Part five is about building a strong domestic market, and consumption is the most frequent term this analysis tracks after security, at 13.64 per 10,000 characters, 72 of 73 occurrences being household rather than energy consumption.10 The main-goals chapter commits to a marked rise in the household consumption rate and to domestic demand becoming a continually stronger driver of growth.3 Alongside it sits the national unified market, a term that appears ten times: a chapter is devoted to advancing it, breaking down the blockages that obstruct it, eliminating local protectionism and market segmentation, and letting goods, factors and resources flow over a wider area.3 10 For an exporter to China this is the more consequential half of the pair, because market segmentation is a large part of why the Chinese domestic market has been hard to sell into as one market.
Green and low-carbon
This is where the binding commitments are concentrated, and the vocabulary matches: carbon appears at 11.02 per 10,000 characters, four times its level in the last plan, and every occurrence is climate vocabulary rather than materials vocabulary.10 Part thirteen carries the transition programme, and five of the eight binding indicators are in the plan's green and low-carbon category.1 China is binding its officials to a low-carbon build-out whose supply chain it already dominates, which is the mechanism by which this section of the plan reaches Indian industry at all.
Supply security, rare earths and minerals
The plan says remarkably little here, and what it says is confident rather than defensive. Rare earths get one sentence of their own in the whole document, committing to keep strengthening China's competitive advantages in rare earths, rare metals and superhard materials and to improve the comprehensive utilisation of important strategic minerals.3 They appear once more, as rare-earth functional materials in Box 2's list of materials to be upgraded.1 Export controls appear exactly once, in the foreign-trade chapter, in a list that runs from strengthening trade risk prevention through trade adjustment assistance and trade remedy tools to improving the export-control system.3 Power batteries appear once in the document, and then only as spent batteries to be recycled at higher value in the carbon box.1 A plan that intended to bargain these instruments away would not describe them as advantages to be strengthened.
Opening to the outside world
Part seven's commitments are institutional: unilateral opening in selected areas, alignment with high-standard international economic and trade rules, and an upgrade strategy for the pilot free trade zones.3 The vocabulary has thinned, with the term for opening to the outside at 1.68 per 10,000 characters against 1.89 in the last plan, and reform and opening at 0.19 against 1.03.10 The direction is not closure; opening is simply no longer the organising story of the document.
Counting words tells us what a document emphasises, not what a state will fund, build or achieve. But emphasis here is not decorative: the Outline is the instrument against which ministries and provinces draft their own five-year plans, and what it foregrounds is what those subordinate documents are written against.
Electronics and Semiconductors
Start with what the plan does say, because it is more specific than the indicator table suggests. Item 1 of Box 3 is a semiconductor programme in six clauses: perfect and refine mature process nodes, raise advanced-node manufacturing capability, accelerate key equipment, materials and components, develop high-performance processors and high-density memory, upgrade wide-bandgap and ultra-wide-bandgap semiconductors, and push compute-in-memory, three-dimensional integration and optoelectronic fusion into application.1 Chapter 8 puts integrated circuits first among six fields for whole-chain breakthroughs under extraordinary measures, and the education chapter commits to expanding degree provision in the same field beyond normal procedure.3 What none of it carries is a quantity: no self-sufficiency percentage, no wafer capacity number, no node target, nothing resembling the 70% domestic market share Made in China 2025 once put in writing, and no binding indicator.
Read from India, the first clause matters most. Perfecting mature process nodes is a commitment to hold and improve the segment that supplies the analogue, power and microcontroller parts Indian assembly lines buy, and that India's own packaging units and first fabs are being built to serve. The equipment-and-materials clause points at the layer above the fab, where India has almost no position. Neither is a forecast of what China will build, and the record on the previous generation of targets is instructive. Made in China 2025 set a 50% domestic market share for semiconductors by 2020 and achieved 16.6%, on the US-China Economic and Security Review Commission's evaluation, with chipmaking-equipment self-sufficiency at 16% in the third quarter of 2024. Where that programme did deliver was volume at mature nodes, with Chinese firms at 33% of global wafer capacity in 2023 against 19% in 2015.12 A plan that writes mature nodes into a programme box is planning to keep the part it won, and Indian mature-node ambitions are being formed against a competitor that says so in writing.
For an Indian electronics business the operative fact is that dependence on Chinese electronics has kept rising while the plan that organises Chinese manufacturing has stopped writing about manufacturing share, and it is now readable line by line rather than as an aggregate. India's trade statistics directorate records China at 15.23% of all Indian merchandise imports in calendar 2024, worth US$109.36 billion.13 Underneath that average the electronics chapter is where the concentration lives. In FY2025-26 China supplied 44.2% of India's imports of HS 85, electrical machinery and electronics, worth US$46.4 billion of a US$104.8 billion bill; 39.8% of HS 84, machinery and computers; 40.8% of computers and servers; 54.3% of telecom equipment; and 50.5% of machines for semiconductor manufacture, a volatile line that ran at 72.6% the year before on a value that grew from US$51 million to US$1,384 million in eight years. All are from the Ministry of Commerce's own import data bank, which puts India's total merchandise imports for the year at US$775.7 billion on this extraction.14
Integrated circuits are the line where the headline share misleads. China's direct share of India's US$30.3 billion of HS 8542 imports was 29.5% in FY2025-26; add Hong Kong, a re-export entrepot rather than a chip producer, and it reaches 47.1%.14 Counting only the China line understates the position by nearly eighteen points on India's most valuable electronics import.
The series matters more than the level, because it is not a story of steady rise. China's share of India's HS 85 imports ran at 39.6% in FY2018-19, jumped to 48.4% in FY2021-22, fell back to 39.5% by FY2023-24 and has climbed again to 44.2%.14 The chip line moved differently: India's integrated-circuit imports tripled from US$8.8 billion to US$30.3 billion while China's direct share fell from 32% to 29.5%.14 Taiwan's share of the same line rose from 1.5% to 11.0% over those years, peaking at 13.9% in FY2024-25, on a value that went from US$132 million to US$3,328 million.15 India is buying far more silicon and a growing part of it from outside China, which is what the assembly and packaging build-out of the last four years looks like in the trade data.
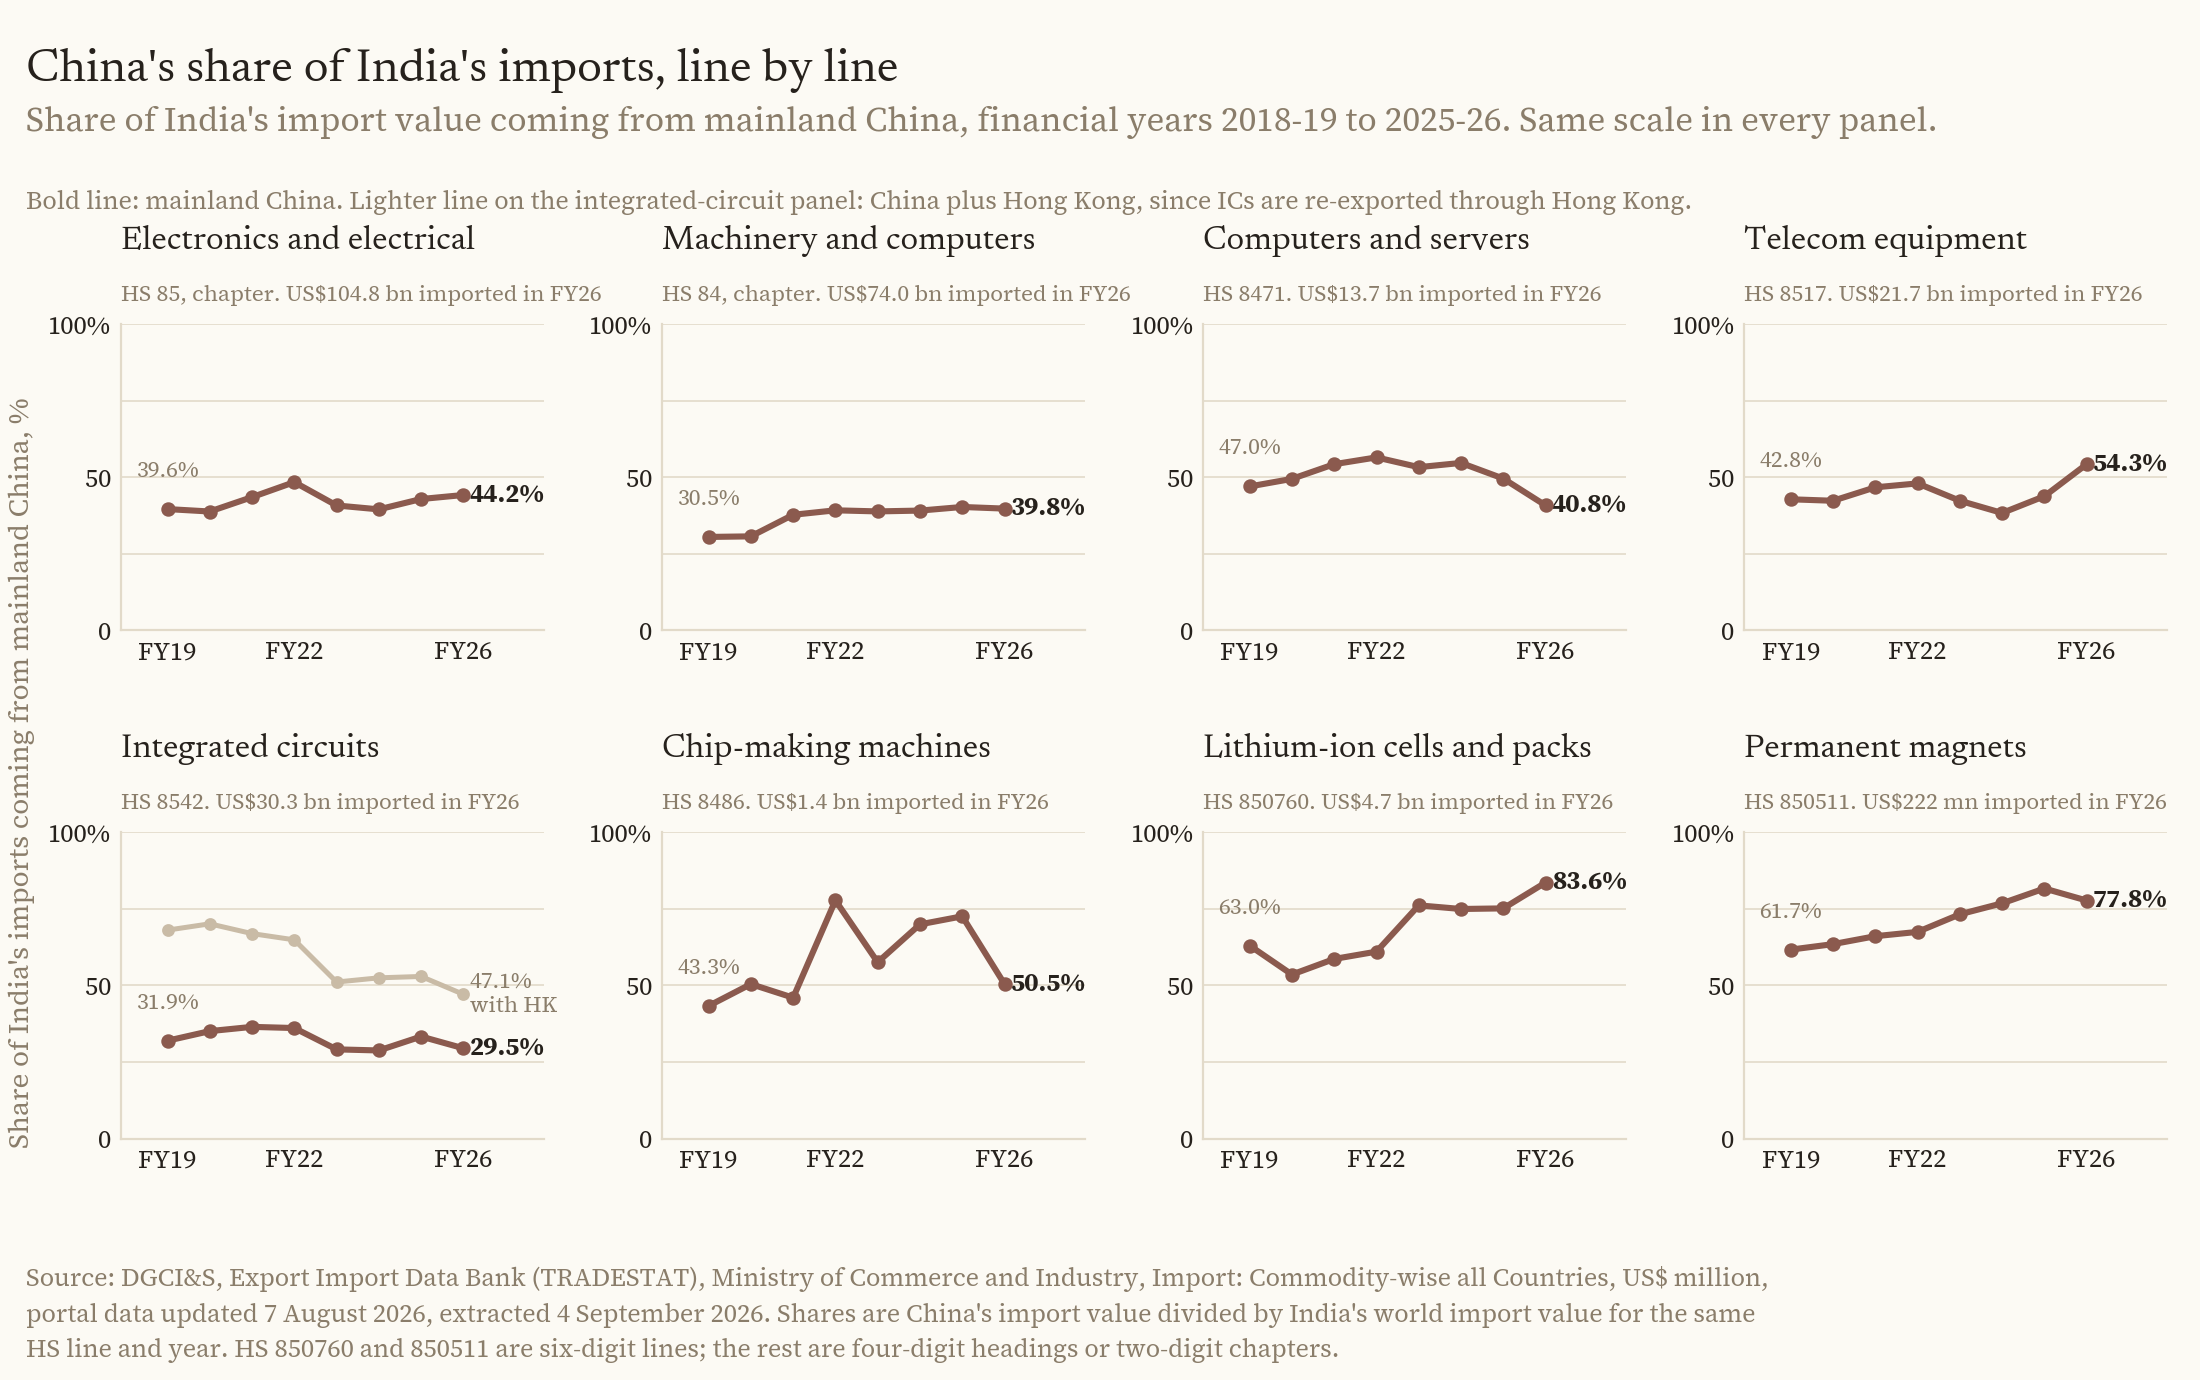
Chart 4. China's share of India's imports for each line, financial years 2018-19 to 2025-26, with China plus Hong Kong shown as a second line on the integrated-circuit panel because re-exports through Hong Kong lift that share from 29.5% to 47.1% in FY2025-26. HS 85 electronics, HS 84 machinery and computers, HS 8471 computers and servers, HS 8517 telecom equipment, HS 8542 integrated circuits, HS 8486 semiconductor manufacturing machines, HS 850760 lithium-ion cells and HS 850511 permanent magnets. Source: DGCI&S TRADESTAT, Export Import Data Bank, Import: Commodity-wise all Countries, US$ million, portal data updated 07/08/2026, extracted 4 September 2026.
Underneath the trade data sits a structural fact. India assembles; it does not make components. MeitY's own scheme notification puts components at about US$1.8 trillion of US$4.3 trillion of global electronics production in 2022, roughly 42%; PRS Legislative Research estimates the Indian figure at about 9% of domestic electronics production in 2023-24.16 17 NITI Aayog, on ITC Trade Map data, puts India's 2024 integrated-circuit imports at US$23.8 billion against US$0.3 billion of exports, a net deficit of about US$23.5 billion, with display panels at US$4.4 billion against US$0.1 billion and batteries at US$3.6 billion against US$0.9 billion.18 Assembly has scaled impressively on the back of that arrangement: electronics production rose from Rs 1.9 lakh crore in FY2014-15 to Rs 11.3 lakh crore in FY2024-25, mobile phone production from Rs 0.18 lakh crore to Rs 5.45 lakh crore, and smartphones became India's largest single export category in calendar 2025 at US$30.13 billion.19 The assembly worked. The layer beneath it did not follow.
Applying the same skepticism to India's instruments that this piece applies to China's plan, the delivery record is mixed and it is early. The instruments are recent: Make in India launched on 25 September 2014 across twenty-five sectors, the production-linked incentive for large-scale electronics manufacturing was notified on 1 April 2020, and the Cabinet extended the incentive to ten further sectors on 11 November 2020 with a Rs 1,45,980 crore outlay.20 21 22 Across all fourteen incentive schemes, Rs 28,748 crore had been disbursed by 31 December 2025 against a Rs 1.91 lakh crore outlay, roughly 15% five years in, on approved investment of Rs 2.16 lakh crore.23 The India Semiconductor Mission, approved in December 2021 at Rs 76,000 crore, had twelve units approved and Rs 1.64 lakh crore committed when its successor was cleared in July 2026: one silicon fab, one silicon-carbide fab, one gallium-nitride display fab and nine packaging units, three of them in commercial production.24 25 Semicon 2.0 followed on 15 July 2026 at Rs 1,27,500 crore.24 The Electronics Component Manufacturing Scheme, approved in March 2025 to attack the components gap, had 75 approvals and Rs 61,671 crore committed by 30 March 2026.26 27 Every one of those numbers is committed or approved rather than built. The Cabinet added an industrial-land instrument alongside them, Bharat Audyogik Vikas Yojna, approved on 18 March 2026 at Rs 33,660 crore with a target of 100 plug-and-play industrial parks.28
The passage in the 15th Plan that bears most directly on how this competition will feel from India is the anti-involution commitment. If Chinese capacity discipline and price governance are actually applied, the deflationary export pricing that has made Indian component localisation look uneconomic becomes less certain. Not unlikely, less certain, and that is the whole of the change one sentence in one chapter entitles a reader to.
EVs, Batteries and Critical Minerals
This chain differs from the other two in kind, not degree. India's exposure here is coercible rather than commercial, because the instrument that could restrict supply is already written, has already been used, and is suspended rather than withdrawn.
Almost none of that is visible in the plan, as the priorities section set out: one sentence on rare earths as an advantage to strengthen; one on export controls, committing to improve the system; power batteries only as waste to be recycled; no rare-earth, critical-mineral or EV-volume target in the indicator box.1 3 What does pull demand through this chain hard is the binding environmental set: non-fossil energy from 21.7% to 25% of total energy consumption, carbon intensity down a cumulative 17%, and energy production capacity from 5.13 to 5.8 billion tonnes of coal equivalent.1
The dominance those commitments run on is not in dispute. In 2025 China accounted for about 75% of global electric-car manufacturing and 40% of electric-car trade, with exports above 2.5 million vehicles, more than 80% of battery cell output, about 85% of cathode active material and more than 90% of anode active material.29 In rare earths it refines about 85% of global supply against roughly 69% of mining.30
India's exposure to that concentration has deepened, and the trade data shows it at the tariff line. India imported US$4,697 million of lithium-ion accumulators in FY2025-26, of which US$3,928 million, or 83.6%, came from China, and 91.2% counting Hong Kong. On the wider accumulator heading, HS 8507, imports were US$5,623 million, 78.3% of it Chinese. Both shares are the highest in the eight years the series covers.14 Analysis by the Institute for Energy Economics and Financial Analysis projects Indian cell demand rising from 28 GWh in 2025 to 272 GWh by FY2030.31
Magnets are the sharper exposure, and two official measures agree on it. China supplied 77.8% by value of India's imports of metal permanent magnets in FY2025-26, on a line worth US$222 million, up from 61.7% in FY2018-19 and peaking at 81.7% in FY2024-25.14 The Ministry of Mines, measuring differently, puts India's permanent-magnet import dependence on China at 59.6% to 81.3% by value and 84.8% to 90.4% by quantity across 2022-23 to 2024-25.32 Hold on to the quantity range, because a magnet's strategic content is not proportional to its price.
One line in the same dataset corrects a common misreading. India barely imports rare-earth compounds: HS 2846 was a US$23 million line in FY2025-26, 15.9% of it Chinese.14 The exposure does not run through the chemistry. It runs through finished magnets, and through the motors, drives and electronics those magnets are already inside when they cross the border, which is what an export-control regime with extraterritorial reach is designed to catch.
The leverage, then, does not live in the plan. It lives in the announcements beside it, and their calendar is the most actionable thing in this piece. On 4 April 2025, in Announcement No. 18 of 2025, the Ministry of Commerce and the General Administration of Customs placed export licensing on seven medium and heavy rare earths, samarium, gadolinium, terbium, dysprosium, lutetium, scandium and yttrium, in metal, alloy, oxide, compound, target-material and magnet form.33 That regime is in force and has never been suspended.30 On 9 October 2025 the same two bodies issued six further announcements, effective 8 November. They added five more rare earths, holmium, erbium, thulium, europium and ytterbium, with their oxides and compounds; rare-earth production equipment, ores, flotation reagents and extraction agents; superhard materials, including synthetic diamond micropowder, single crystals, wire saws and grinding wheels, and the equipment and process technology behind them; lithium batteries at or above 300 Wh/kg, with lithium iron phosphate and ternary-precursor cathode materials, synthetic graphite anode materials and the equipment to make them; and rare-earth extraction, separation, smelting, magnet-making and recycling technologies. One of the six reaches outside China, licensing foreign-made items containing Chinese-origin rare-earth material at 0.1% or more by value, and items made abroad using Chinese rare-earth technology.34 35 36 37 38 39 In November all six were suspended while the April controls stayed in place.30 The suspension is not open-ended, and its end date is in the announcement itself: Announcement No. 70 of 2025, of 7 November, suspended the six October announcements from that day until 10 November 2026.40 That falls inside the first year of the plan period. Nor has the machinery been idle during the pause. MOFCOM issued Announcement No. 26 of 2026 on 24 June, effective 1 July, creating a reporting mechanism for suspected violations of strategic-mineral export controls, with thirteen categories of reportable conduct including transhipment through third countries.41 Enforcement tightened inside the window.
Nothing in the plan says what China will do on that date, and this piece does not know. What can be said is that its one sentence on export controls commits to improving the system rather than restraining its use, and its one sentence on rare earths treats them as an advantage to be strengthened. Neither reads like a document preparing to give the instrument up.
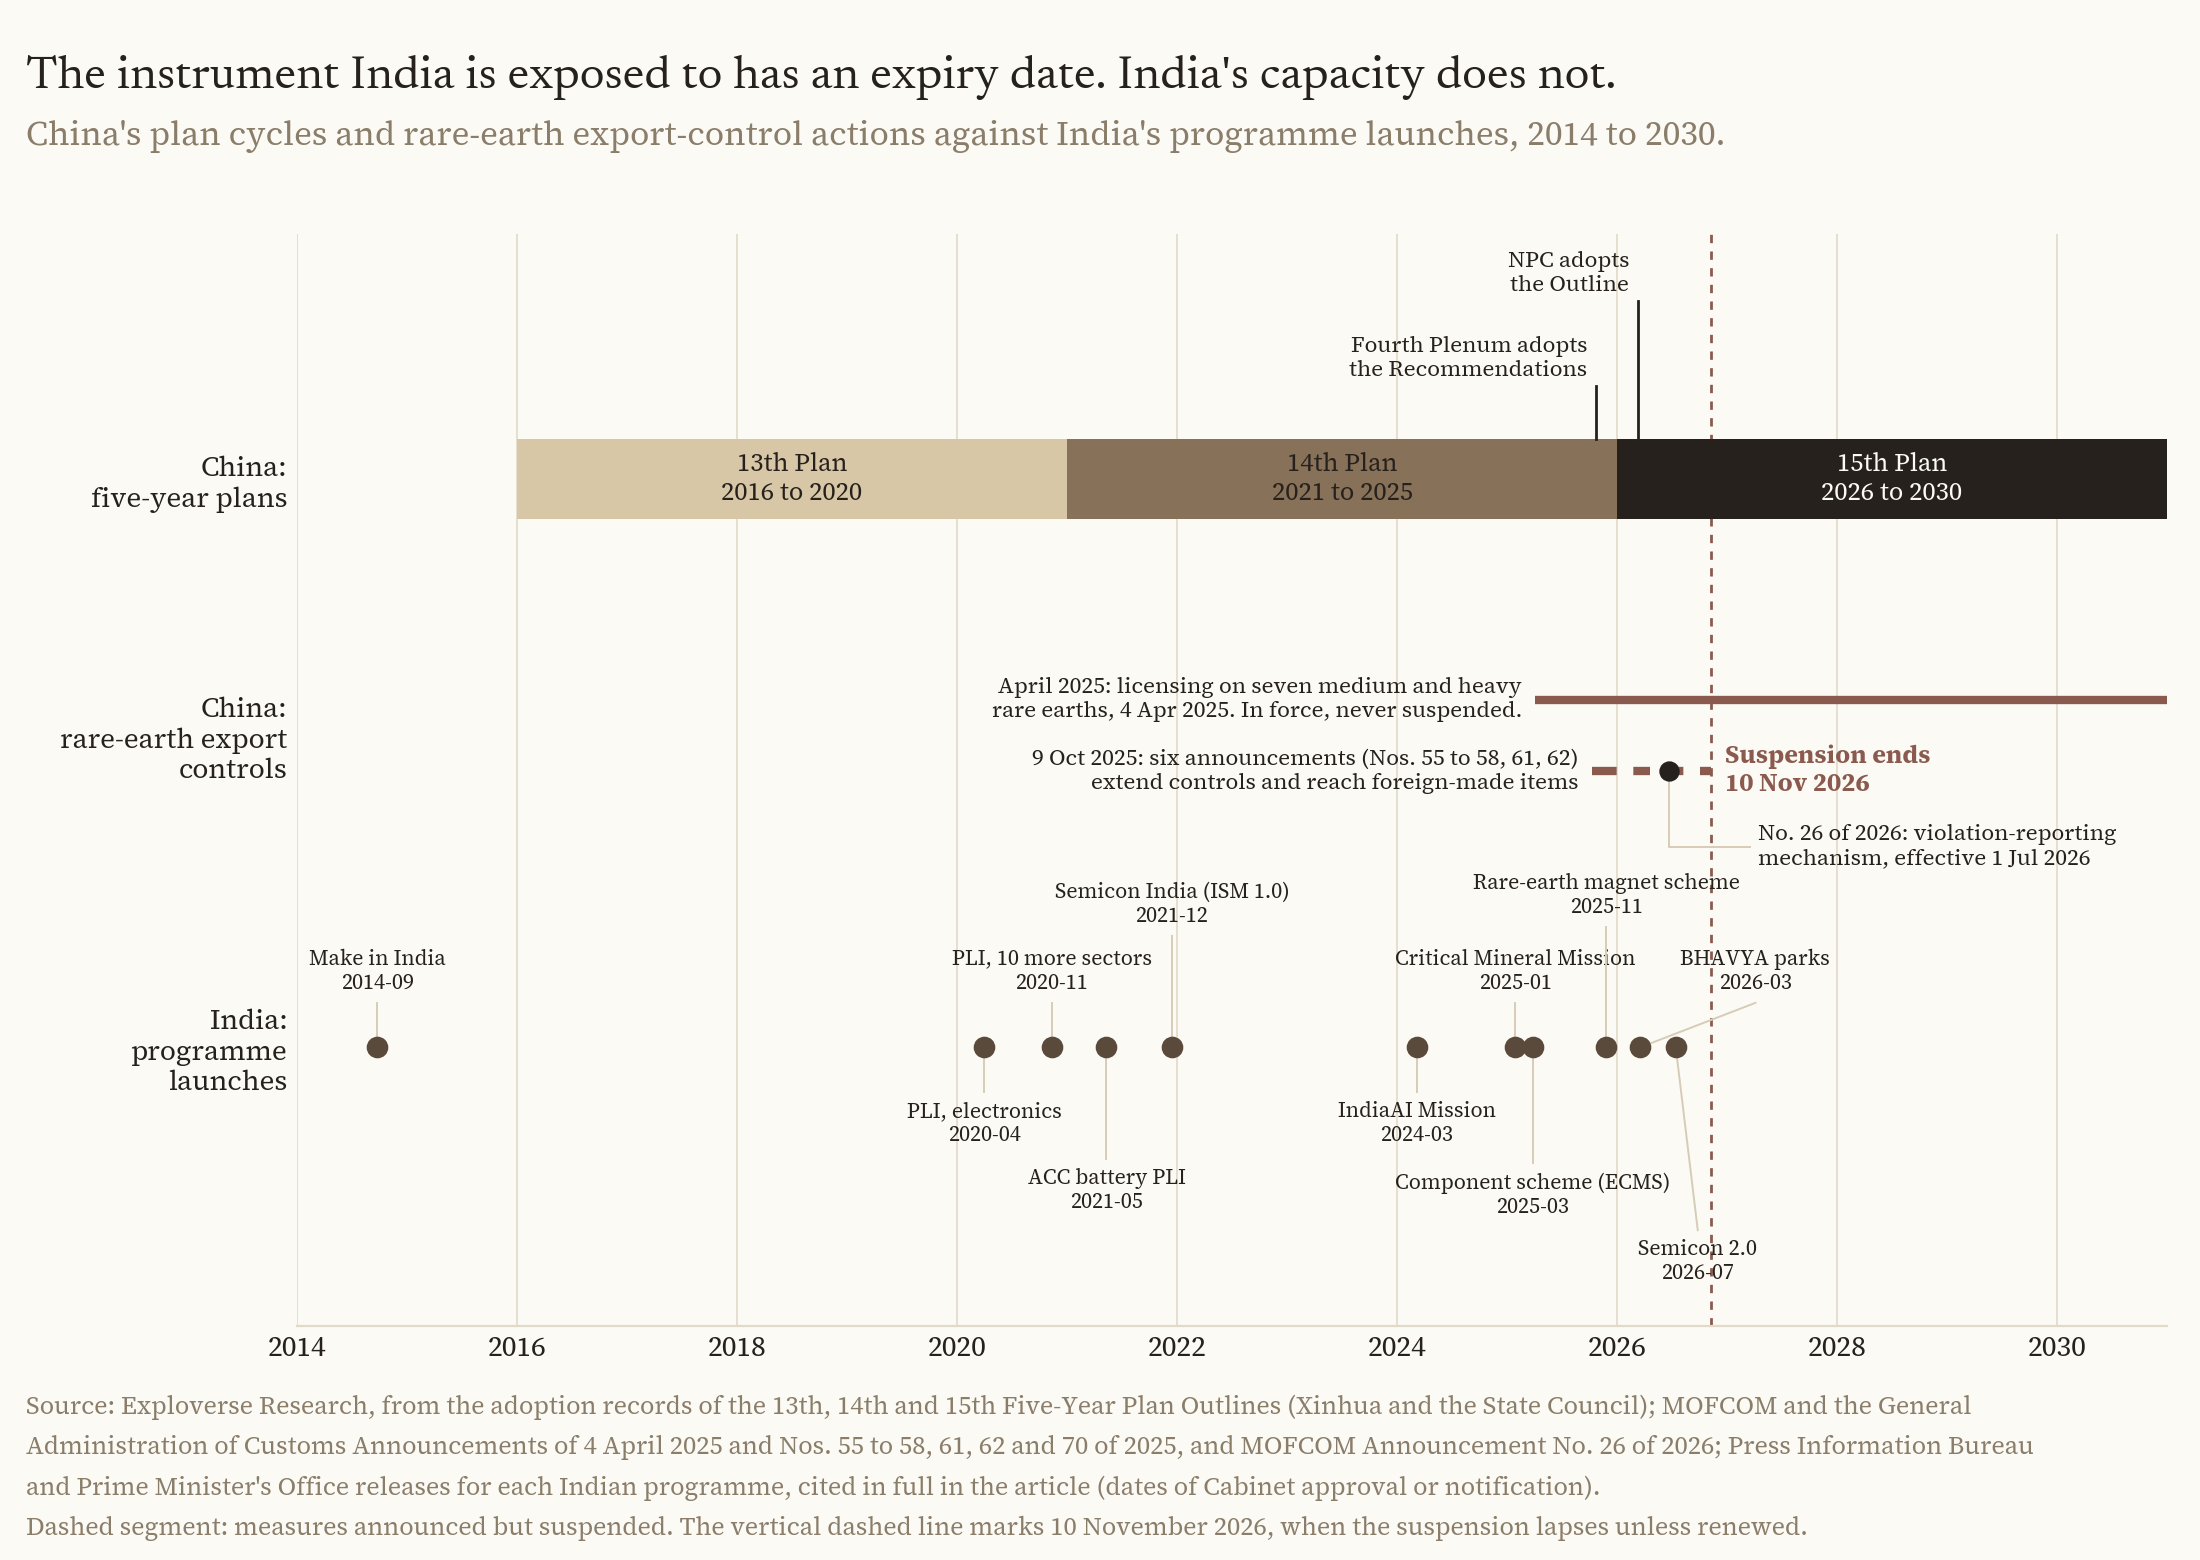
Chart 5. China's plan cycles and export-control actions against India's programme launches, 2014 to 2030, with the 10 November 2026 expiry of the export-control suspension marked. Every Indian marker is the date of Cabinet approval or scheme notification in the release named below. Source: Exploverse Research, from Chinese plan adoption dates, MOFCOM and General Administration of Customs Announcements No. 18, Nos. 55 to 58, Nos. 61 and 62 and No. 70 of 2025 and MOFCOM Announcement No. 26 of 2026; and, for the Indian programmes, Press Information Bureau and Prime Minister's Office releases for Make in India (2014), the electronics production-linked incentive (2020), the ten-sector PLI approval (2020), the ACC battery PLI (2021), Semicon India (2021), the IndiaAI Mission (2024), the National Critical Mineral Mission (2025), the Electronics Component Manufacturing Scheme (2025), the rare-earth magnet scheme (2025), BHAVYA (2026) and Semicon 2.0 (2026).
India's counterweight is under construction and behind schedule, and it would be dishonest to read China's plan as intention while reading India's schemes as fact. The Advanced Chemistry Cell incentive scheme, approved in May 2021 at Rs 18,100 crore against a 50 GWh target, had 1.4 GWh commissioned as of February 2026, 2.8% of target, with zero incentives disbursed.31 42 The National Critical Mineral Mission, approved in January 2025 with a Rs 34,300 crore headline of which Rs 16,300 crore is government money, had launched 523 of a targeted 1,200 exploration projects and acquired five lithium blocks in Argentina, with production projected only at the end of 2029.43 44 Of 88 critical and strategic mineral blocks put to auction, 56 had been auctioned by June 2026.45 The Rare Earth Permanent Magnet scheme, approved on 26 November 2025 at Rs 7,280 crore, targets 6,000 tonnes a year of sintered magnet capacity, with a two-year gestation and nothing commissioned yet.46 32 Six thousand tonnes a year against 85% to 90% dependence by quantity on one supplier is the sector's whole argument in one comparison.
AI, Compute and the Digital Economy
This is where the plan is emphatic enough that the emphasis is itself the finding, and where India's problem is competition rather than dependence.
Two things follow from the compute and application chapters above. First, the bet is on diffusion rather than frontier leadership: the language is about application, penetration and cost, not model capability rankings, and the phrase it repeats is empowerment of industries.3 Second, the compute it intends to run that diffusion on is domestic, because the same chapter that promises cheap compute for smaller firms promises an autonomous and controllable hardware and software stack under it.3 Chips are not the headline because, in the logic of the document, chips are an input to compute and compute is an input to diffusion.
Of the three innovation numbers in the headline indicator table, only one measures a technology outcome rather than an input, and it is a diffusion measure. Value added of core digital-economy industries is to rise from 10.5% of GDP to 12.5% by 2030, and it is classified expected, not binding.1 Two percentage points over five years is not an aggressive number, and the calibration makes it less aggressive still. The 14th Plan set the same indicator at 7.8% in 2020 and targeted 10% for 2025.47 6 China's statistics bureau put 2023 at 9.9% and 2024 at 10.5%, worth CNY 14.09 trillion, in a release dated 30 December 2025.48 49 The last plan's target was therefore met a year early, and this plan's baseline is that same 2024 number; no 2025 figure has been published, because the bureau releases this series at the end of the following year. The plan is asking for two points on an indicator that has already cleared its predecessor's target, which is the shape of a target set to be met.
The physical build behind it is larger than the target implies. On the figures the State Council's own English service carried in August 2025, China's total intelligent computing capacity had reached about 780,000 PFLOPS, second in the world, of which about 620,000 PFLOPS sat inside the eight national computing hubs.50 That is a mid-2025 figure and the plan period had not yet begun.
India's position here is not dependence but competition on unequal infrastructure. IndiaAI, approved in March 2024 with a Rs 10,372 crore outlay, had more than 38,000 GPUs onboarded for its common compute facility as of March 2026, with 190 projects approved for compute access.51 The mission's first-year spending tells a slower story: the Union Budget's expenditure statement records actuals of Rs 19.24 crore for IndiaAI in 2024-25 against a Rs 552 crore allocation, and a revised estimate of Rs 800 crore against a Rs 2,000 crore budget for 2025-26.52 17 India's data-centre capacity was about 1.4 GW in 2025, with a projection to 8 GW by 2030, and India hosts roughly 3% of the world's data centres while generating close to 20% of the world's data.17
On the demand side India is further along than the compute numbers suggest. The measurement commissioned by MeitY and carried out by ICRIER puts India's digital economy at 11.74% of gross value added in 2022-23, Rs 28.94 lakh crore of GVA, projected to about a fifth of GVA by 2029-30.53 That figure is not comparable with China's 10.5%, and putting the two side by side without saying so would be an error. India's measure follows an OECD framework supplemented by an Asian Development Bank approach and includes digitally enabled activity in banking, trade and education; China's counts core digital industries only, on a narrower national-accounts definition, against GDP rather than GVA.48 53 Neither government publishes a like-for-like comparison.
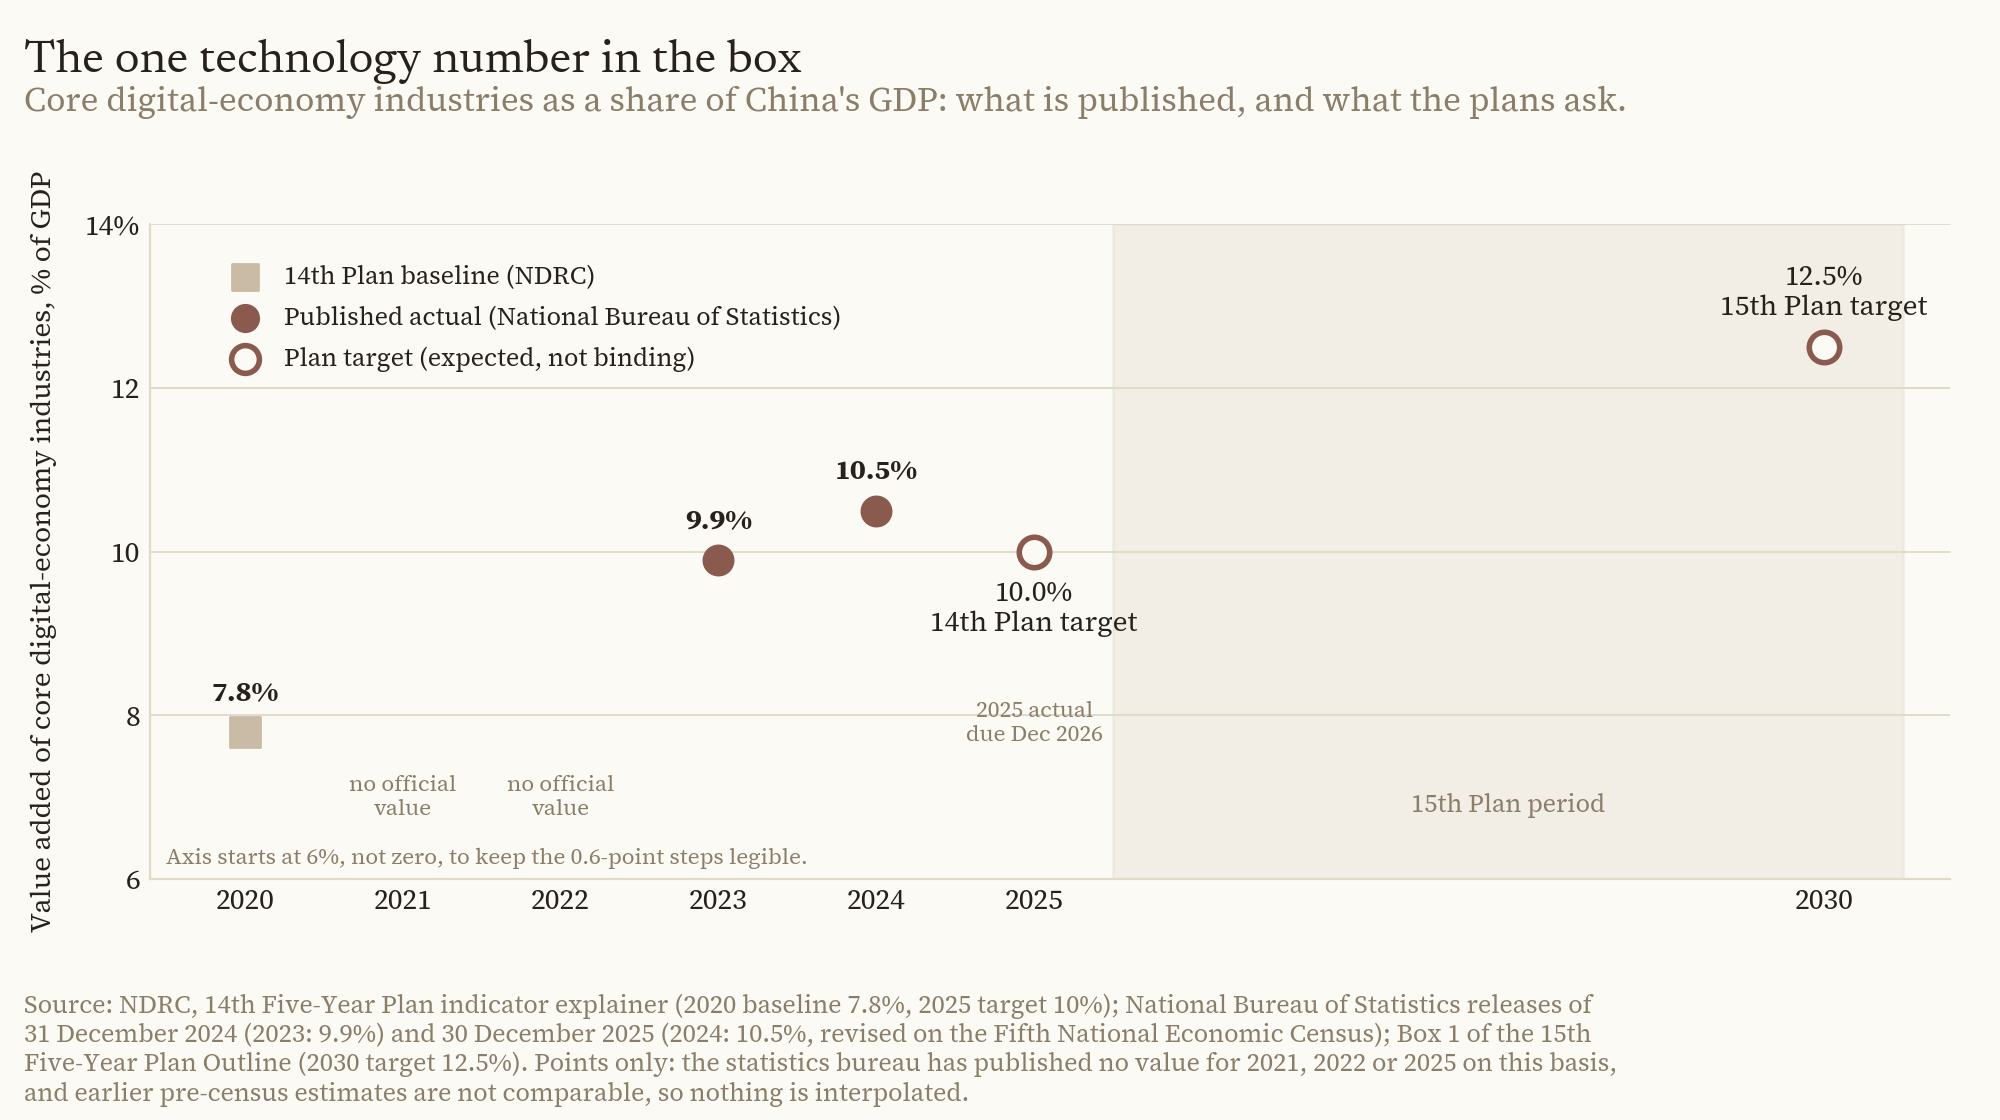
Chart 6. Core digital-economy industries as a share of China's GDP. Five points only, drawn as points rather than a line: the 14th Plan's 2020 baseline of 7.8% and its 2025 target of 10%, the statistics bureau's actuals of 9.9% for 2023 and 10.5% for 2024, and the 15th Plan's 12.5% for 2030. No official value exists for 2021, 2022 or 2025 on this basis, and pre-census estimates must not be spliced in. The indicator is expected, not binding. Source: NDRC indicator page for the 14th Five-Year Plan; National Bureau of Statistics of China annual releases for 2023 and 2024; Box 1 of the 15th Five-Year Plan Outline.
Where Indian Firms Should Position
Three sectors, three different problems. What follows is addressed to firms, and every call rests on the evidence above.
Electronics and components: buy insurance, and price it honestly
The plan commits China to no industrial outcome that touches this trade, and nothing in the export-control record reaches these lines. The exposure is commercial rather than coercive, which sounds reassuring and is not: commercial exposure at 44.2% of a US$104.8 billion import bill is a pricing dependency no counterparty has to threaten in order to exercise.14
The positioning that follows is unglamorous. Component localisation should be underwritten as an insurance purchase with a stated premium, not sold internally as a cost saving, because on current Chinese pricing it usually is not one. The premium is the number for the board paper, and the sizing test is concentration line by line rather than in aggregate. The Global Trade Research Initiative proposes that dependence on a single country stay below 30% in a critical sector, which is a reasonable working ceiling. That threshold is single-sourced and reached through a messenger: GTRI's own report page no longer resolves, and the proposition is taken from Business Standard's reporting of it.54 On the trade data, telecom equipment at 54.3%, semiconductor manufacturing machines at 50.5%, lithium-ion cells at 83.6% and metal permanent magnets at 77.8% all sit far above it, while integrated circuits sit below it on the China line alone and well above it once Hong Kong is counted.14 That ordering, not the chapter average, is where the premium is worth paying first. The logic bites hardest in the segments India barely makes at all, given components run at about 9% of Indian electronics production against roughly 42% globally: passives, printed circuit boards, display and camera modules, and enclosures.16 17 Firms already inside the component scheme have recent approvals and unbuilt capacity, so the design choice is still open.
The thing to watch, rather than assume, is whether the plan's capacity-discipline language turns into actual capacity exits in Chinese component industries during 2027 and 2028. If it does, Indian localisation cases improve without any Indian policy changing.
Batteries, magnets and minerals: take the qualification cost before November
This is the one sector where a single date decides the sequencing. The April 2025 licensing regime on seven rare earths is in force. The October 2025 expansion, which reached lithium batteries and graphite anode and cathode materials and carried extraterritorial effect, is suspended until 10 November 2026.40 An Indian firm whose bill of materials passes through any of those lines is inside a window whose end date is published, in the first year of a plan that describes the underlying advantage as one to be strengthened.3
Three positions follow. The first is to dual-source at the material level rather than the cell or magnet level, because the chokepoint is processing, not assembly: China's shares of cathode and anode active material, roughly 85% and above 90%, are higher than its share of cells at above 80% and higher again than its share of vehicles.29 A second cell supplier who buys the same cathode powder is not a second source. The same logic runs one step further down: India's imports of rare-earth compounds are a rounding error at US$23 million a year, so the material that matters arrives already built into magnets and into the assemblies those magnets sit in.14 The second is to complete qualification of any alternative material before the November date, because qualification takes quarters and licensing decisions take weeks. The cost of doing it early is known; the cost of doing it late is not.
The third is where an Indian entrant can hold a position by 2030 rather than merely participate. Cell manufacturing is the hardest place to start: 1.4 GWh commissioned against a 50 GWh target, with zero incentives disbursed, is not a base for a 272 GWh market in four years.31 Recycling and magnet manufacturing are the segments where an Indian entrant starts nearest the chokepoint, because both convert a domestic feedstock into refined material that would otherwise be imported at the processing stage where the exposure is worst, and because both have live instruments behind them, a Rs 1,500 crore recycling incentive and a Rs 7,280 crore magnet scheme.44 32 The magnet scheme's 6,000 tonnes a year will not close a dependence running at 85% to 90% by quantity, so the position to take there is a first-mover one in a market that will still be short, not a substitution play.32
AI and IT services: the competition arrives in third markets first
The compute chapter and the "AI Plus" chapter together say China is betting on economy-wide diffusion of AI, running on domestic compute, with the cost of compute for smaller firms named as an explicit objective.3 It is not betting on frontier model leadership, and the one technology number it publishes is a diffusion share.1
For Indian IT services and AI infrastructure businesses that has three consequences. The competition will be in vertical AI deployment for manufacturing, logistics and public-service customers, the layer the plan names, rather than in model building. It will arrive priced on Chinese domestic compute costs, which the plan is working to lower, so competing on rate cards is a losing position and competing on domain integration and data residency is not. And it will arrive in South East Asia, the Gulf and Africa before it arrives in India, because the international section of the plan's digital part points at digital co-operation, offshore compute facilities and cross-border data infrastructure rather than at the Indian market.3
The infrastructure gap is a constraint to plan around. India has 38,000-odd GPUs in a shared national facility and 1.4 GW of data-centre capacity heading toward 8 GW; China had about 780,000 PFLOPS of intelligent computing capacity before the plan period even opened, most of it concentrated in eight national hubs.51 17 50 Those are not comparable units and should not be arithmetically compared, but the direction is not ambiguous. The positions that survive a gap of that shape are ones where proximity to the customer's data and processes matters more than raw training capacity, which is most enterprise deployment work and very little foundation-model work.
What the Plan Promises
A plan that binds its officials to forest cover and grain capacity, and merely encourages them on patents and digital-economy share, has not run out of industrial ambition. It has decided industrial ambition is not the kind of thing you deliver by assigning a number to a provincial governor. What China has committed to by 2030 is a floor: cleaner air, a quarter of its energy from non-fossil sources, food and energy it can produce itself, and a workforce with four-tenths of a year more schooling. Everything competitive sits above that floor, in the expected column, in the prose and in twenty-two programme boxes that name what China intends to build without committing anyone to build it, and will be delivered, if it is delivered, through instruments that never appear in the Outline.
That is the part Indian industry should take seriously: a competitor who has stopped writing outcome targets has not stopped competing, it has stopped publishing the scoreboard. The three exposures traced here are not symmetrical and should not be managed as one. The electronics exposure is a price, and prices can be paid deliberately once sized. The battery and magnet exposure is a permission, and permissions are granted by someone else, on a calendar that here is public and expires on 10 November 2026. The AI exposure is neither: a race whose Chinese entrant is being handed cheap domestic compute and a mandate to push it into a thousand industries, and which will be decided in the markets both countries sell into rather than in either home market.
Two things between now and 2030 are worth watching more than any speech. The first is 10 November 2026, the only date on which a written instrument changes state. The second is whether core digital-economy industries actually move toward 12.5% of Chinese GDP, the one number in the box that measures deployment of the thing this plan is about. Neither is a forecast. Both are checkable, which is more than most of what will be written about the next five years.
Sources
- 专栏1 “十五五”时期经济社会发展主要指标 (Box 1, main indicators for economic and social development in the 15th Five-Year Plan period), in the adopted Outline as published by 国家发展和改革委员会 (National Development and Reform Commission), PDF of the adopted text, March 2026.
- 政府工作报告 (Government Work Report, delivered by Premier Li Qiang to the Fourth Session of the 14th National People's Congress), 新华社, 5 March 2026.
- 中华人民共和国国民经济和社会发展第十五个五年规划纲要 (Outline of the 15th Five-Year Plan for National Economic and Social Development of the People's Republic of China), 新华社受权发布, news.cn, 13 March 2026.
- 两会新华视点|“十五五”规划纲要草案的新指标、新看点 (Xinhua Viewpoint: the new indicators in the draft 15th Five-Year Plan Outline), 新华社, reposted by 生态环境部 (Ministry of Ecology and Environment), 8 March 2026.
- “十五五”时期主要目标和重大任务,一文看懂 (Main goals and major tasks of the 15th Five-Year Plan period, explained), 福建省发展和改革委员会 (Fujian Provincial Development and Reform Commission), 6 March 2026.
- 中华人民共和国国民经济和社会发展第十四个五年规划和2035年远景目标纲要 (Outline of the 14th Five-Year Plan and Long-Range Objectives Through 2035), 新华社 via 中国政府网, 13 March 2021.
- Key things to know about formulation of recommendations for China's 15th five-year plan, The State Council of the People's Republic of China, 31 October 2025.
- 中共中央关于制定国民经济和社会发展第十五个五年规划的建议 (CPC Central Committee Recommendations for Formulating the 15th Five-Year Plan), 中共中央 via 中国政府网, 28 October 2025.
- 十四届全国人大四次会议在京闭幕 (Fourth Session of the 14th National People's Congress closes in Beijing), 人民日报, 12 March 2026.
- Term-frequency analysis of the complete Chinese texts as published of the 13th, 14th and 15th Five-Year Plan Outlines, Exploverse Research, September 2026. Script at misc/term_frequency.py, raw counts at data/raw/indicators/term-frequency.csv.
- 中华人民共和国国民经济和社会发展第十三个五年规划纲要 (Outline of the 13th Five-Year Plan for National Economic and Social Development), 新华社 via 中国政府网, 17 March 2016.
- Made in China 2025: Evaluating China's Performance, Daniel Blaugher and Benton Gordon, U.S.-China Economic and Security Review Commission, 14 November 2025.
- A Quick View of India's Trade Scenario, Directorate General of Commercial Intelligence and Statistics, Ministry of Commerce and Industry, 19 August 2025.
- Imports from China by HS line, FY2018-19 to FY2025-26, Export Import Data Bank (TRADESTAT), Directorate General of Commercial Intelligence and Statistics, Ministry of Commerce and Industry, Government of India, portal data updated 7 August 2026, extracted 4 September 2026. Dataset published with this article at data/raw/india/dgcis-imports-from-china-by-hs.csv.
- India's imports of electronic integrated circuits (HS 8542) from Taiwan, FY2018-19 to FY2025-26, Export Import Data Bank (TRADESTAT), Directorate General of Commercial Intelligence and Statistics, Ministry of Commerce and Industry, Government of India, portal data updated 7 August 2026.
- Notification, Electronics Components Manufacturing Scheme, Ministry of Electronics and Information Technology, 8 April 2025.
- Demand for Grants 2026-27 Analysis: Ministry of Electronics and Information Technology, Niranjana S Menon, PRS Legislative Research, 4 March 2026.
- Trade Watch Quarterly, July-September (Q2) FY 2025-26, NITI Aayog, February 2026, using ITC Trade Map data.
- India emerges as Second Largest Mobile Manufacturing Country; Smartphone Exports lead in 2025, Press Information Bureau, Ministry of Electronics and Information Technology, 2026.
- Prime Minister to Launch 'Make in India' Initiative, Press Information Bureau, Ministry of Commerce and Industry, 24 September 2014.
- Production Linked Incentive Schemes, factsheet, Press Information Bureau, Government of India, recording the notification of the large-scale electronics manufacturing scheme on 1 April 2020.
- Cabinet approves PLI Scheme to 10 key Sectors for Enhancing India's Manufacturing Capabilities, Prime Minister's Office, 11 November 2020.
- Production Linked Incentive Scheme with Rs 1.91 Lakh Crore Outlay Drives Strong Industry Participation Across 14 Strategic Sectors, Press Information Bureau, Department for Promotion of Industry and Internal Trade, 20 February 2026, figures as of 31 December 2025.
- Cabinet approves Semicon 2.0, Press Information Bureau, Union Cabinet, 15 July 2026.
- Cabinet approves Programme for Development of Semiconductors and Display Manufacturing Ecosystem in India, Press Information Bureau, Union Cabinet, 15 December 2021.
- Government approves 29 more proposals under the Electronics Component Manufacturing Scheme (ECMS), Press Information Bureau, Ministry of Electronics and Information Technology, 30 March 2026.
- Cabinet approves Electronics Component Manufacturing Scheme for making India Atmanirbhar in electronics supply chain, Press Information Bureau, Union Cabinet, 28 March 2025.
- Cabinet approves a New Era of Plug-and-Play Industrial Development through Bharat Audyogik Vikas Yojna (BHAVYA), Prime Minister's Office, 18 March 2026.
- Manufacturing and trade, Global EV Outlook 2026, International Energy Agency, 2026.
- Global Critical Minerals Outlook 2026, International Energy Agency, 2026.
- Securing India's battery supply chain is more critical than ever, Institute for Energy Economics and Financial Analysis, 29 May 2026.
- Rare Earth Permanent Magnet Manufacturing Scheme, Press Information Bureau press note, Ministry of Mines, 27 December 2025.
- 商务部、海关总署公告2025年第18号 公布对部分中重稀土相关物项实施出口管制的决定 (MOFCOM and General Administration of Customs Announcement No. 18 of 2025, export controls on certain medium and heavy rare-earth related items), Ministry of Commerce and General Administration of Customs of the People's Republic of China, 4 April 2025.
- 商务部、海关总署公告2025年第55号 公布对超硬材料相关物项实施出口管制的决定 (MOFCOM and General Administration of Customs Announcement No. 55 of 2025, export controls on superhard-material related items), Ministry of Commerce and General Administration of Customs of the People's Republic of China, 9 October 2025, effective 8 November 2025.
- 商务部、海关总署公告2025年第56号 公布对部分稀土设备和原辅料相关物项实施出口管制的决定 (MOFCOM and General Administration of Customs Announcement No. 56 of 2025, export controls on certain rare-earth equipment and raw and auxiliary materials), Ministry of Commerce and General Administration of Customs of the People's Republic of China, 9 October 2025, effective 8 November 2025.
- 商务部、海关总署公告2025年第57号 公布对部分中重稀土相关物项实施出口管制的决定 (MOFCOM and General Administration of Customs Announcement No. 57 of 2025, export controls on certain medium and heavy rare-earth related items), Ministry of Commerce and General Administration of Customs of the People's Republic of China, 9 October 2025, effective 8 November 2025.
- 商务部、海关总署公告2025年第58号 公布对锂电池和人造石墨负极材料相关物项实施出口管制的决定 (MOFCOM and General Administration of Customs Announcement No. 58 of 2025, export controls on lithium-battery and synthetic-graphite anode-material related items), Ministry of Commerce and General Administration of Customs of the People's Republic of China, 9 October 2025, effective 8 November 2025.
- 商务部公告2025年第61号 公布对境外相关稀土物项实施出口管制的决定 (MOFCOM Announcement No. 61 of 2025, export controls on rare-earth items outside China), Ministry of Commerce of the People's Republic of China, 9 October 2025.
- 商务部公告2025年第62号 公布对稀土相关技术实施出口管制的决定 (MOFCOM Announcement No. 62 of 2025, export controls on rare-earth related technologies), Ministry of Commerce of the People's Republic of China, 9 October 2025.
- 商务部、海关总署公告2025年第70号 (MOFCOM and General Administration of Customs Announcement No. 70 of 2025, suspending the six announcements of 9 October 2025), Ministry of Commerce and General Administration of Customs of the People's Republic of China, 7 November 2025.
- 商务部公告2026年第26号 (MOFCOM Announcement No. 26 of 2026, on reporting violations of export controls on strategic-mineral dual-use items), Ministry of Commerce of the People's Republic of China, issued 24 June 2026, effective 1 July 2026.
- Cabinet approves Production Linked Incentive scheme National Programme on Advanced Chemistry Cell Battery Storage, Prime Minister's Office, 12 May 2021.
- Cabinet Approves National Critical Mineral Mission, Prime Minister's Office, 29 January 2025.
- National Critical Mineral Mission, status presentation, Ministry of Mines, Government of India, 10 January 2026.
- India's Critical Mineral Mission Gains Momentum: 56 Critical Mineral Blocks and 11 Exploration Licence Blocks Successfully Auctioned, Press Information Bureau, Ministry of Mines, 23 June 2026.
- Cabinet Approves Rs.7,280 Crore Scheme to Promote Manufacturing of Sintered Rare Earth Permanent Magnets (REPM), Press Information Bureau, Union Cabinet, 26 November 2025.
- “十四五”规划《纲要》主要指标之6:数字经济核心产业增加值占GDP比重 (14th Five-Year Plan main indicator 6, value added of core digital-economy industries as a share of GDP), 国家发展和改革委员会 发展战略和规划司 (NDRC, Department of Development Strategy and Planning), 25 December 2021.
- 2024年全国数字经济核心产业增加值占GDP比重为10.5% (Core digital-economy industries were 10.5% of GDP in 2024), National Bureau of Statistics of China, 30 December 2025.
- 2023年全国数字经济核心产业增加值占GDP比重为9.9% (Core digital-economy industries were 9.9% of GDP in 2023), National Bureau of Statistics of China, 31 December 2024.
- China's intelligent computing capacity ranks second globally, The State Council of the People's Republic of China, 28 August 2025, carrying Xinhua's report from the 2025 China International Big Data Industry Expo.
- IndiaAI Mission Expands AI Ecosystem with Affordable Compute and Startup Support, Press Information Bureau, Ministry of Electronics and Information Technology, 25 March 2026.
- Notes on Demands for Grants 2026-2027, Demand No. 27, Ministry of Electronics and Information Technology, Union Budget 2026-27, Ministry of Finance, Government of India, 7 February 2026.
- Estimation and Measurement of India's Digital Economy, Deepak Mishra, Mansi Kedia, Aarti Reddy and others, Indian Council for Research on International Economic Relations, prepared for the Ministry of Electronics and Information Technology, January 2025.
- China supplies over 30% of industrial goods; overdependence critical: GTRI, Business Standard, 28 April 2026, reporting a Global Trade Research Initiative analysis of Ministry of Commerce data.